The first task to perform with Wireshark is examining HTTP requests and responses, which are used to view Web pages. This happens at layer 7 of the OSI model.
wireshark
Another box pops up warning that 'Running as user "root" and group "root"' is dangerous. Press Enter to close it.
It's worth noting that Wireshark can be exploited by attackers, but if you are using virtual machines with no personal data on them, the risk is small.
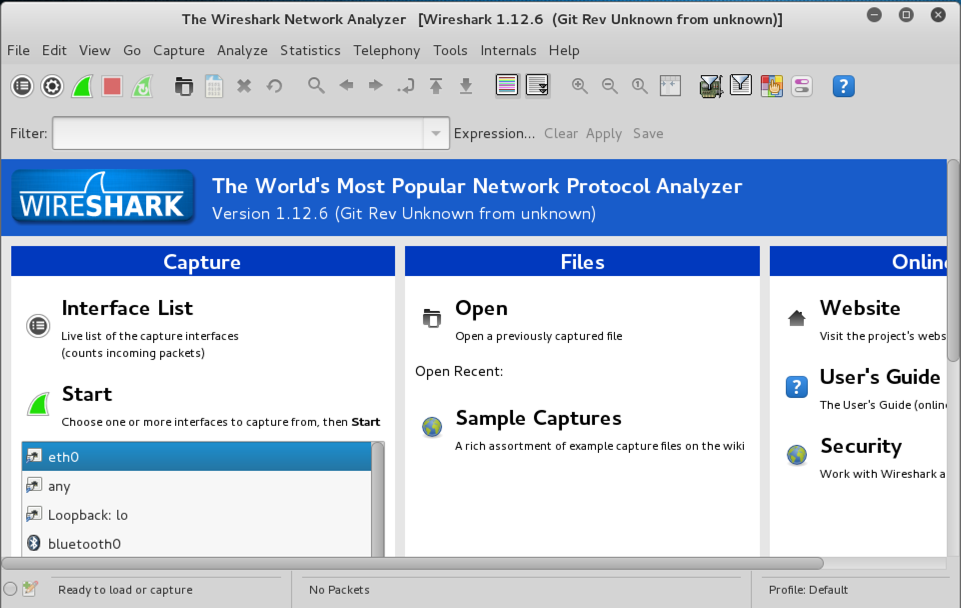
In the lower left of the Wireshark window, under the Start button, click eth0 to highlight it, as shown below.
On the left side of the Kali desktop, click the topmost icon to open IceWeasel. Go to attack.samsclass.info.
Wireshark shows a lot of text scrolling by, as shown below on this page. Each line in the upper pane summarizes one frame (or packet).
Find these columns in the Wireshark window:
- No Frame Number
- Time Time in seconds that the frame was captured
- Source Source address of the frame
- Destination Destination address of the frame
- Protocol Protocol of the frame
- Info Other information
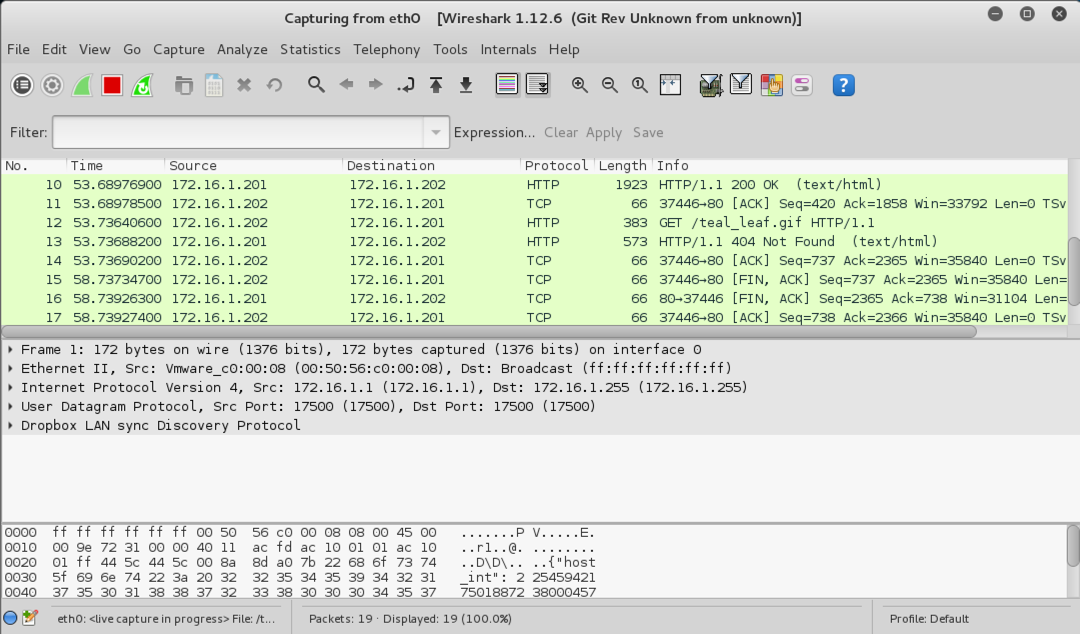
Notice that some lines show Broadcast in the Destination column. Broadcast traffic is common on networks as network devices alert one another of their presence. But it's usually not very interesting. To make Wireshark easier to use, you can Filter the traffic, to see only the interesting packets.
http
Wireshark now shows only HTTP packets, as shown below.
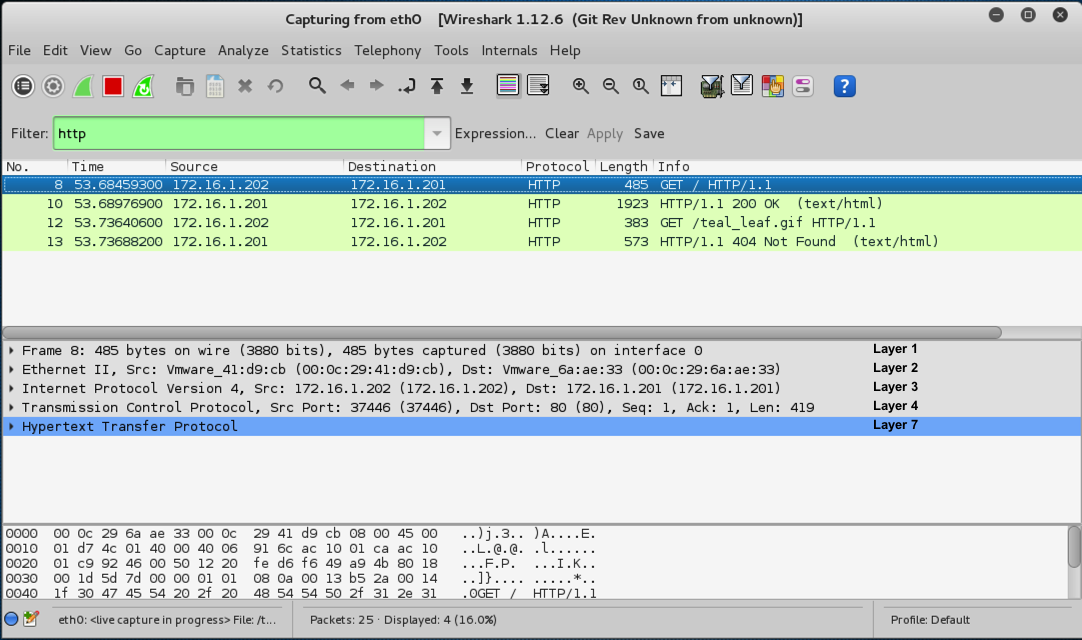
Look at the middle pane of Wireshark to see this packet dissected into the most important OSI layers.
The layers are labelled in black font on the right side of the image above.
Layer 1: Physical shows bits on the wire
Layer 2: Data Link shows an Ethernet frame, with MAC addresses
Layer 3: Network shows an IP packet, with IP addresses
Layer 4: Transport shows a TCP segment, with port numbers
Layer 7: Application shows an HTTP request
The next packet, with "Info" of "HTTP/1.1 200 OK...", is the response from the Web server.
From the Wireshark menu bar, click Analyze, "Follow TCP Stream".
This is the most convenient way to examine HTTP traffic. The request is shown in red, and the response is shown in blue, as shown below.
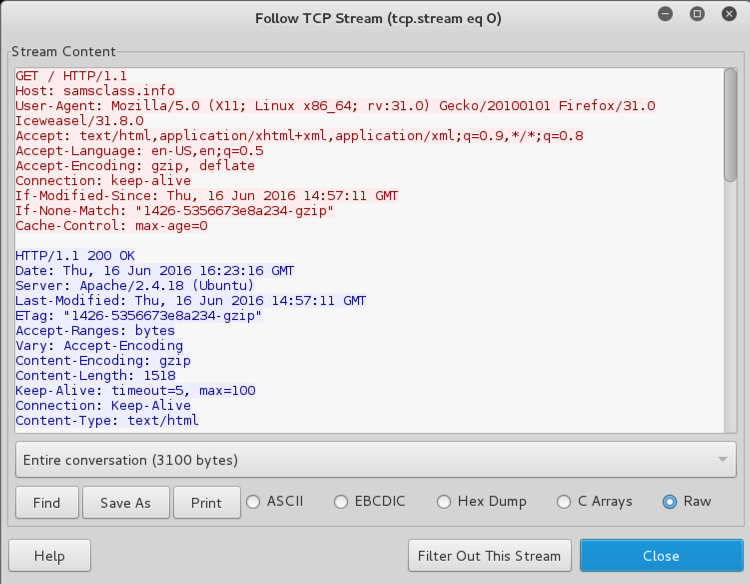
In the "Follow TCP Stream", click Close.
Last modified: 8-14-13 12:40 pm
Modified for NETLAB 6-16-16