The first task to perform with Wireshark is examining HTTP requests and responses, which are used to view Web pages. This happens at layer 7 of the OSI model.
http://www.wireshark.org/download.html
to download and install it. It will also install WinPCap.
At the top of the menu, a Wireshark item appears. Right-click Wireshark and click "Run as Administrator". If a User Account Control box appears, allow the program to run.
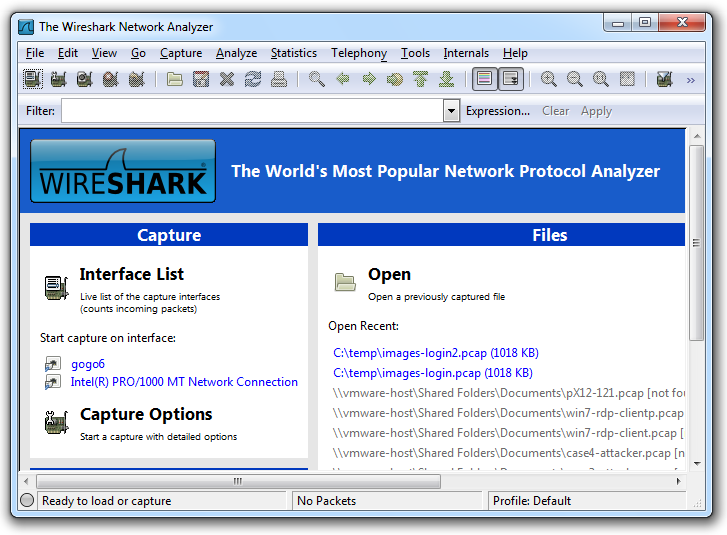
Wiresharks opens, as shown below.
In the upper left of the Wireshark window, click "Interface List".
A list of network interfaces appears. Each interface has an IP address and a count of Packets, as shown below.
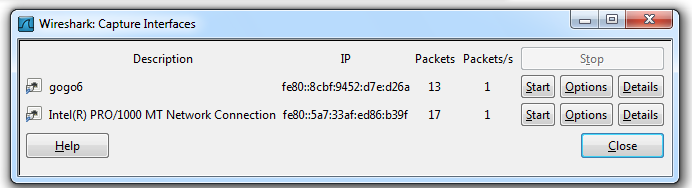
At first, all the IP addresses start with fe80: -- these are "Link-Local IPv6 Addresses", and they very useful.
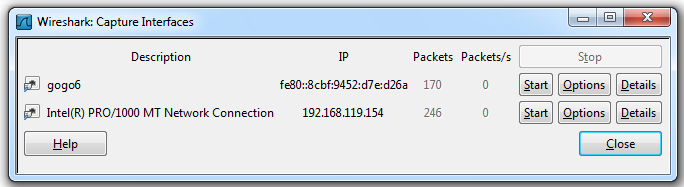
Find the network interface with the most rapidly increasing number of packets--this is the interface that connects to the Internet. Click its IP address.
Wireshark will show the other addresses of this interface.
After one or more clicks, you should see the IPv4 address of the interface, which is four values separated by periods, as shown below:
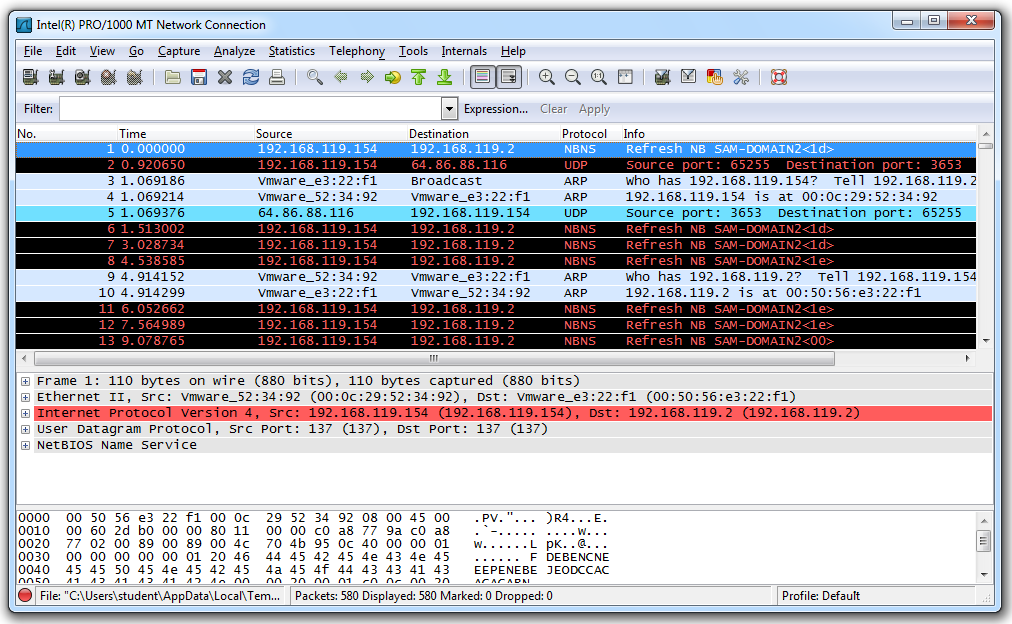
Click the Start button next to the interface that connects to the Internet.
You should see a lot of text scrolling by, as shown below on this page. Each line in the upper pane summarizes one frame (or packet).
Find these columns in the Wireshark window:
- No Frame Number
- Time Time in seconds that the frame was captured
- Source Source address of the frame
- Destination Destination address of the frame
- Protocol Protocol of the frame
- Info Other information
Notice that some lines show Broadcast in the Destination column. Broadcast traffic is common on networks as network devices alert one another of their presence. But it's usually not very interesting. To make Wireshark easier to use, you can Filter the traffic, to see only the interesting packets.
http
Wireshark now shows only HTTP packets, as shown below.
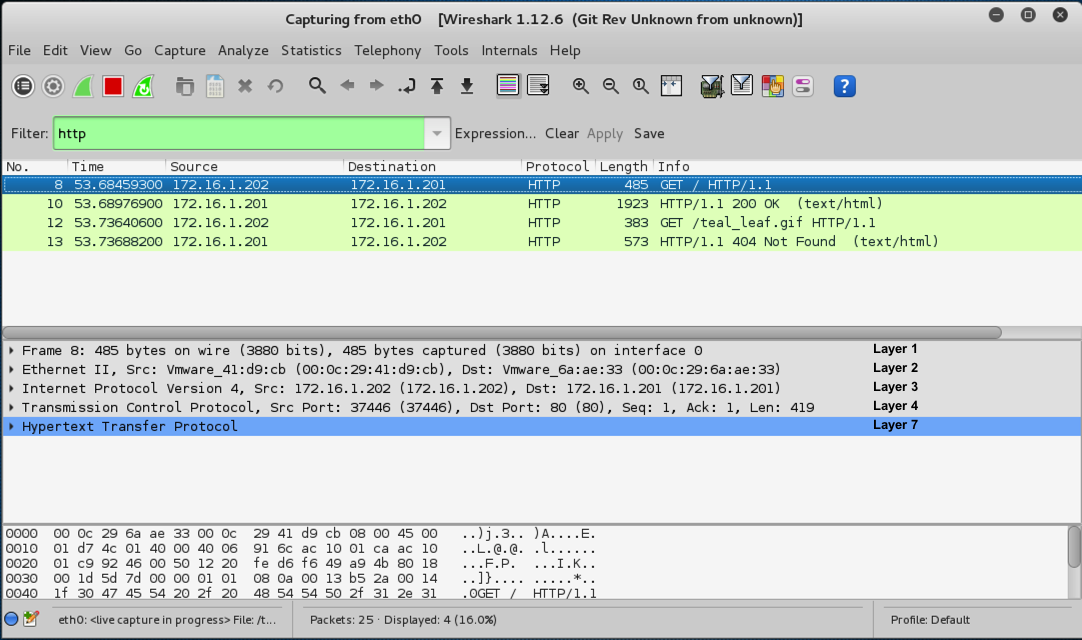
Look at the middle pane of Wireshark to see this packet dissected into the most important OSI layers.
The layers are labelled in black font on the right side of the image above.
Layer 1: Physical shows bits on the wire
Layer 2: Data Link shows an Ethernet frame, with MAC addresses
Layer 3: Network shows an IP packet, with IP addresses
Layer 4: Transport shows a TCP segment, with port numbers
Layer 7: Application shows an HTTP request
The next packet, with "Info" of "HTTP/1.1 200 OK...", is the response from the Web server.
From the Wireshark menu bar, click Analyze, "Follow TCP Stream".
This is the most convenient way to examine HTTP traffic. The request is shown in red, and the response is shown in blue, as shown below.
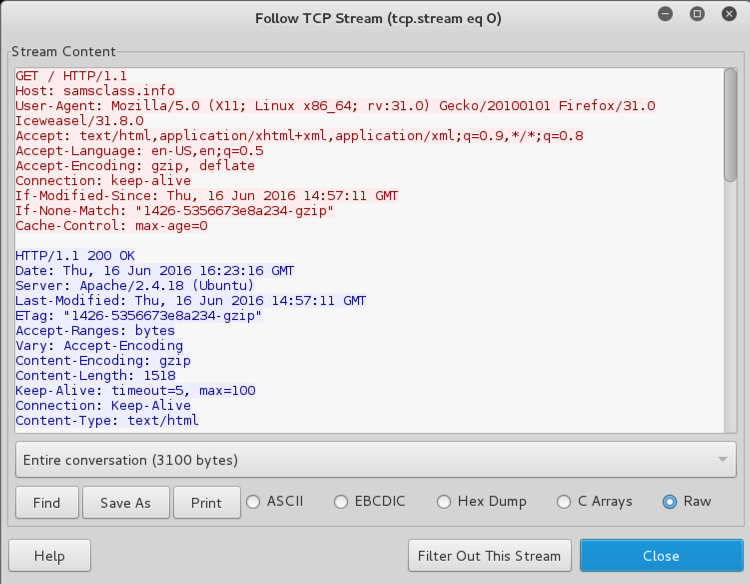
In the "Follow TCP Stream", click Close.
Last modified: 6-16-16