x0, y0 = ts[5, :].X, ts[5, :].Y # Initial sample--X is location, Y is classification
noise_type = 'l2' # Type of perturbation 'l1' or 'l2'
dmax = 0.4 # Maximum perturbation
lb, ub = 0, 1 # Bounds of the attack space. Can be set to `None` for unbounded
y_target = None # Move until the model gets any wrong answer
# Should be chosen depending on the optimization problem
solver_params = {
'eta': 0.3,
'eta_min': 0.1,
'eta_max': None,
'max_iter': 100,
'eps': 1e-4
}
from secml.adv.attacks.evasion import CAttackEvasionPGDLS
pgd_ls_attack = CAttackEvasionPGDLS(
classifier=svm,
double_init_ds=tr,
double_init=False,
distance=noise_type,
dmax=dmax,
lb=lb, ub=ub,
solver_params=solver_params,
y_target=y_target)
# Run the evasion attack on x0
y_pred_pgdls, _, adv_ds_pgdls, _ = pgd_ls_attack.run(x0, y0)
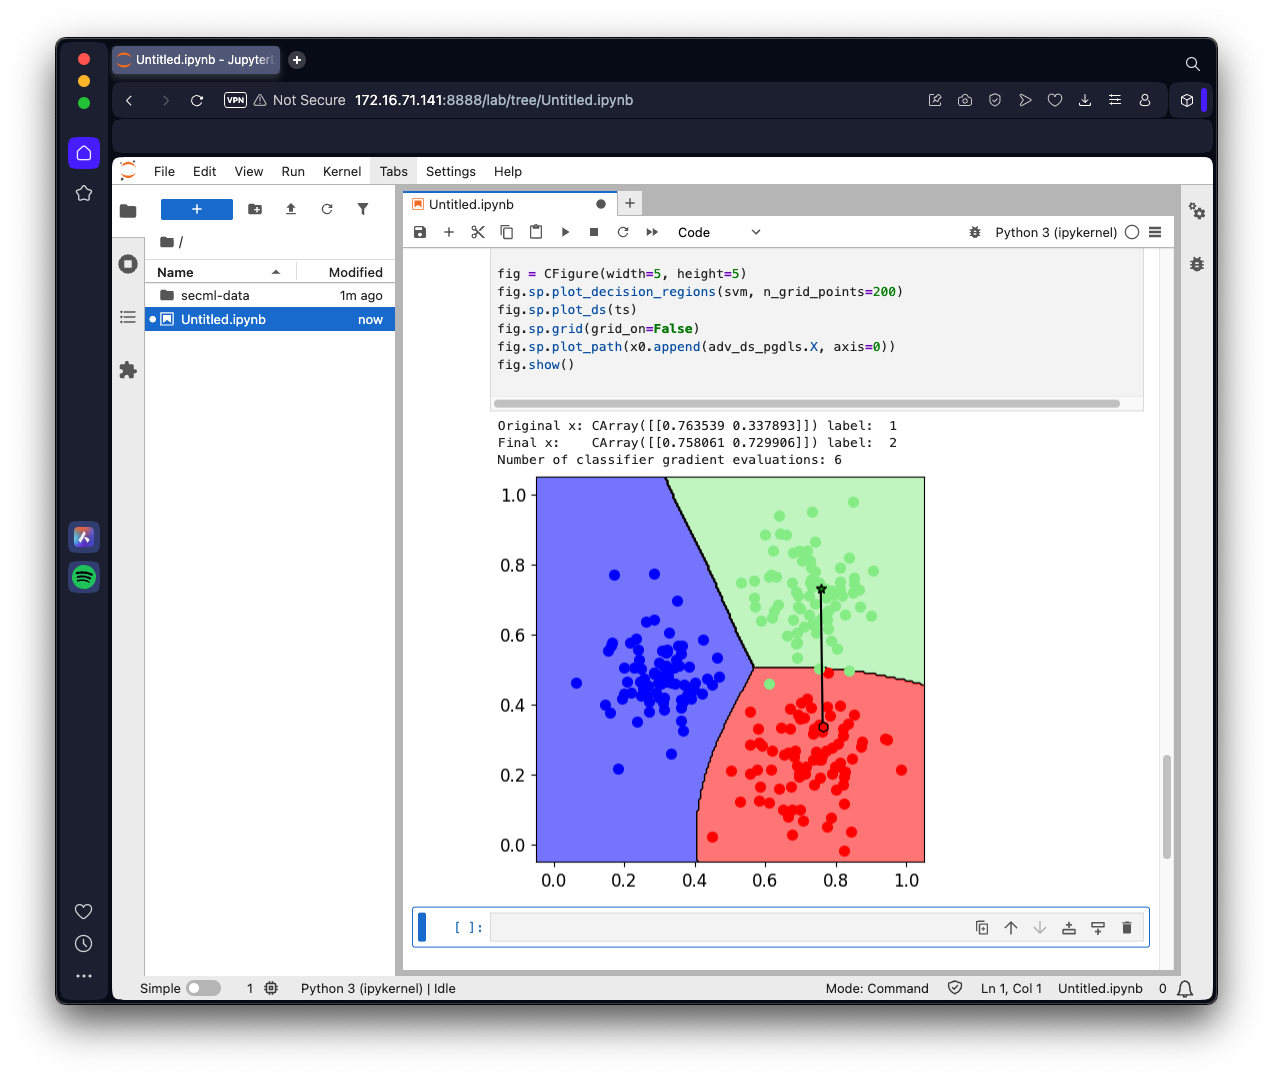
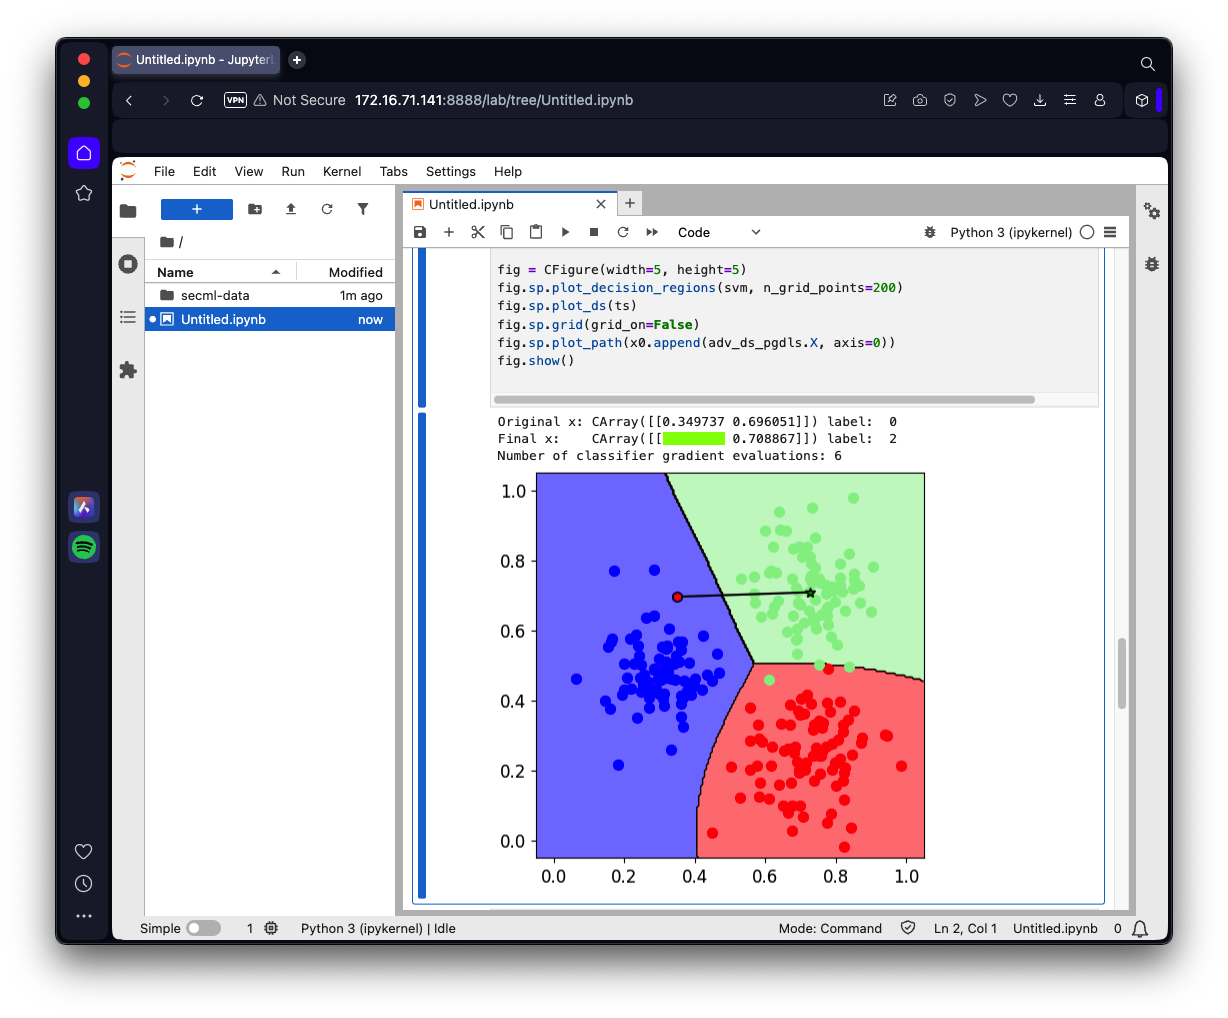
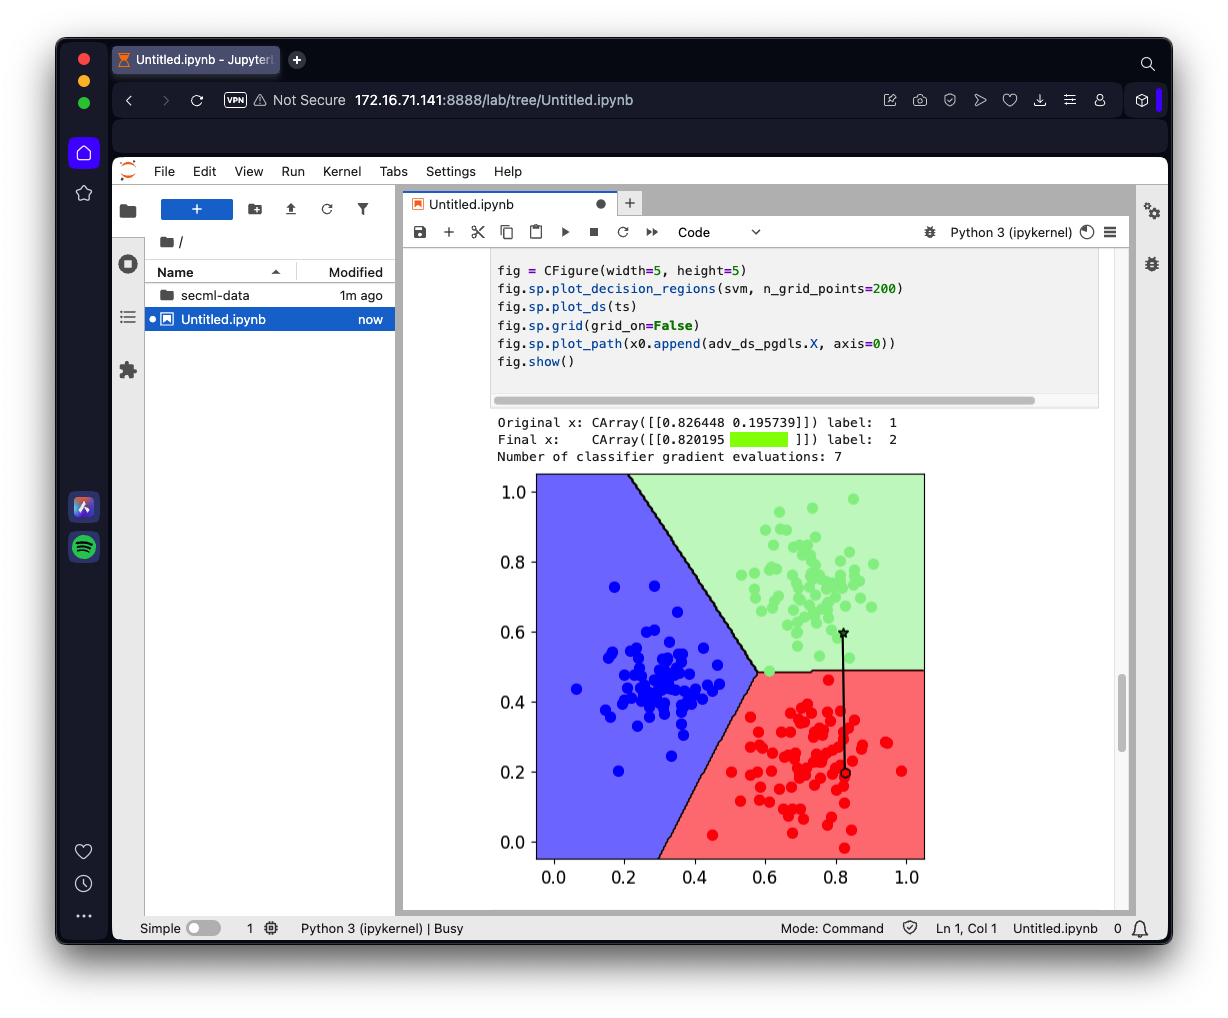
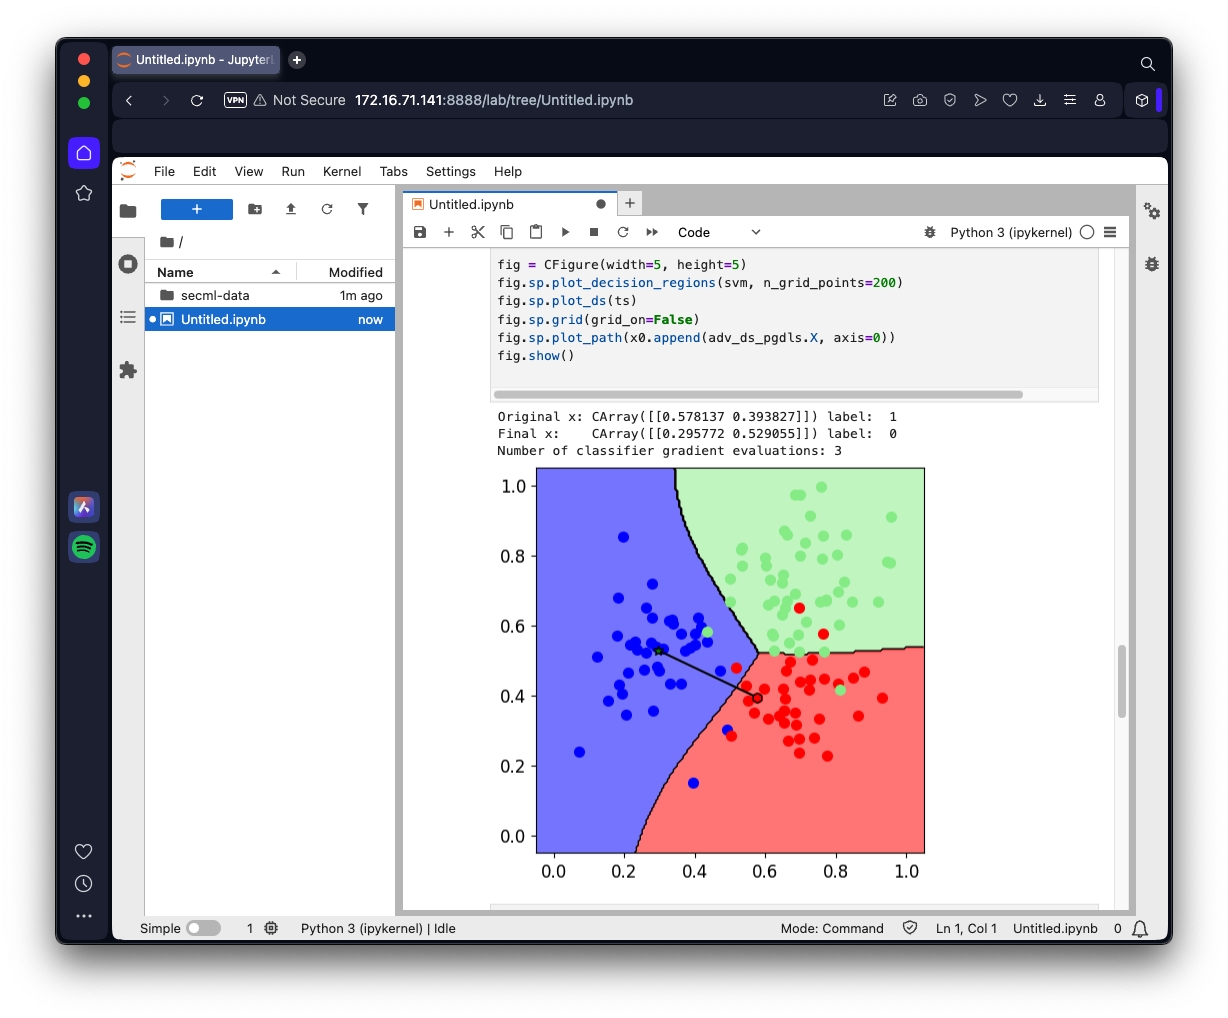
print("Original x:", x0, "label: ", y0.item())
print("Final x: ", adv_ds_pgdls.X, "label: ", y_pred_pgdls.item(), )
print("Number of classifier gradient evaluations: {:}"
"".format(pgd_ls_attack.grad_eval))
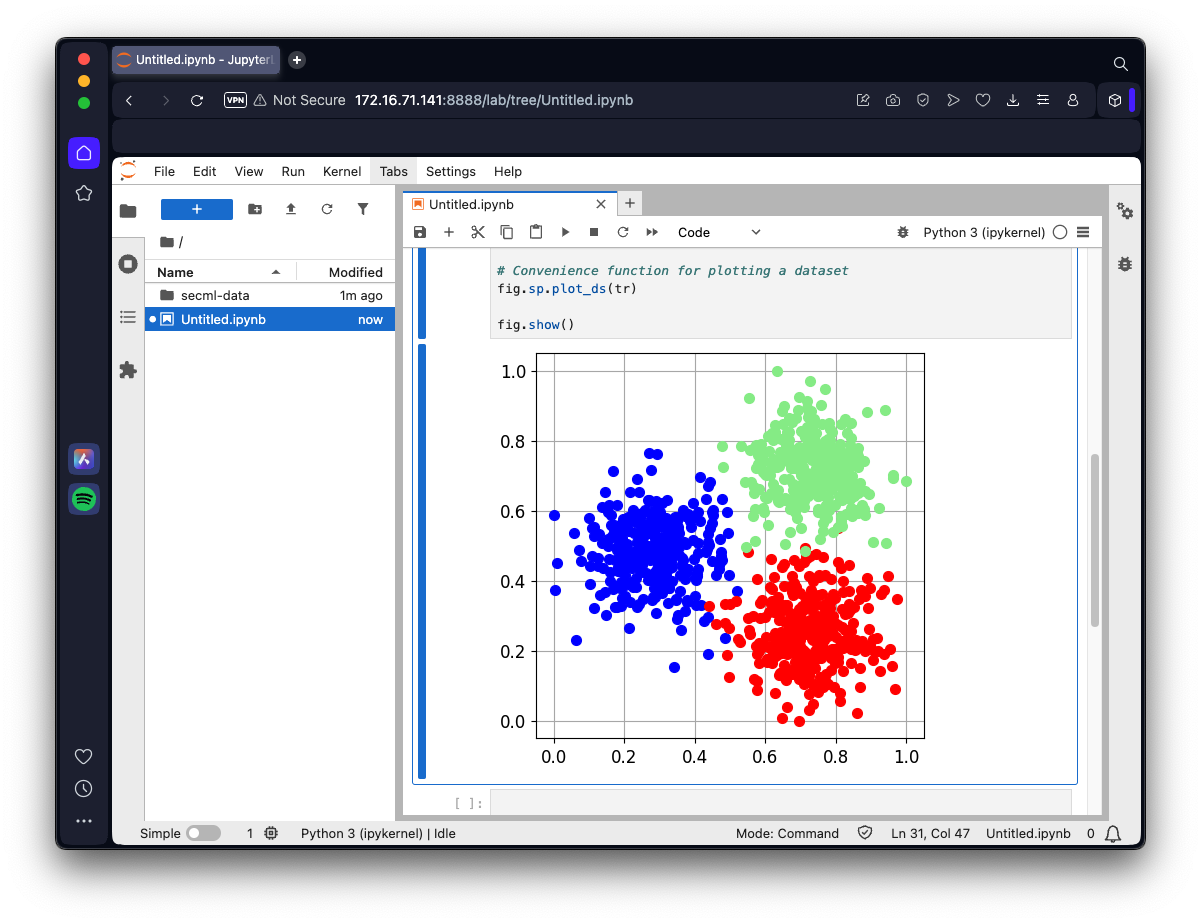
fig = CFigure(width=5, height=5)
fig.sp.plot_decision_regions(svm, n_grid_points=200)
fig.sp.plot_ds(ts)
fig.sp.grid(grid_on=False)
fig.sp.plot_path(x0.append(adv_ds_pgdls.X, axis=0))
fig.show()