Proj 1x: BOSS OF THE SOC: Finding Attack Servers (35 pts)
What You Need for this Project
- A computer with a Web browser
- An account on my Canvas server to record your scores. To make one, go
here
Purpose
To practice threat hunting, using
the
Boss of the SOC (BOTS) Dataset.
This project uses only the stream:http
data.
Connecting to My Splunk Server
Go here:
https://splunk.samsclass.info
Log in using these credentials,
as shown below.
- If you are a CCSF student registered in CNIT 50, use the username in your
CCSF email address (the part before "@mail.ccsf.edu") and an initial password of changeme
- Otherwise, log in as student1 with a password of student1
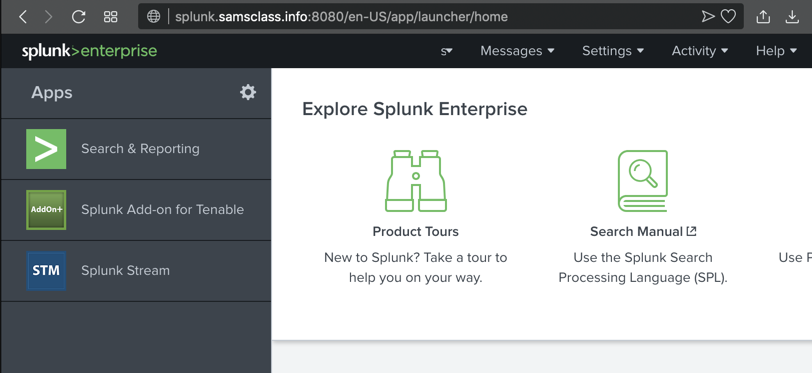
Once you are logged in, at the top left,
click "Search & Reporting",
as shown below.
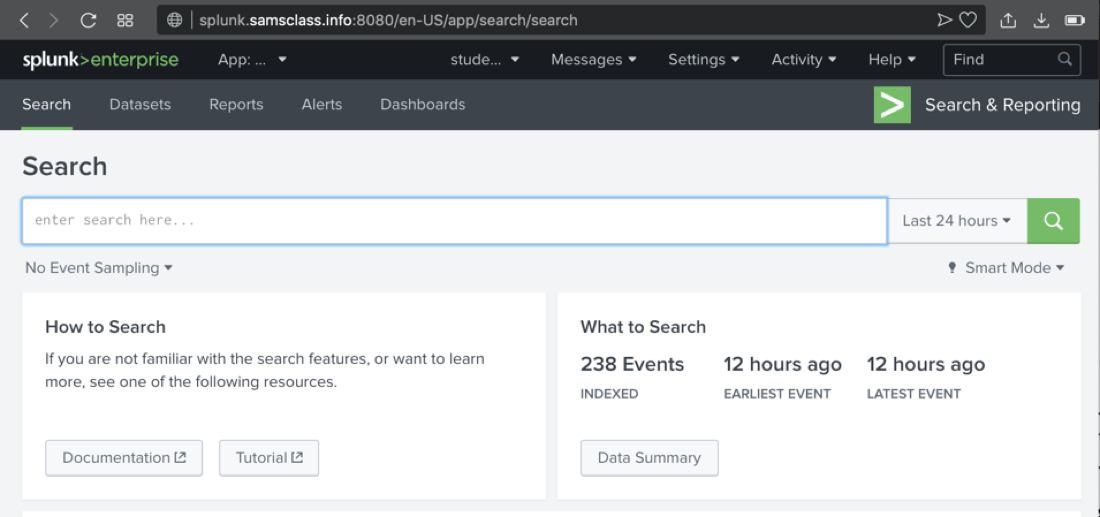
The "Search" page opens,
as shown below.
Exploring the BOTS Data
Sampling the Data
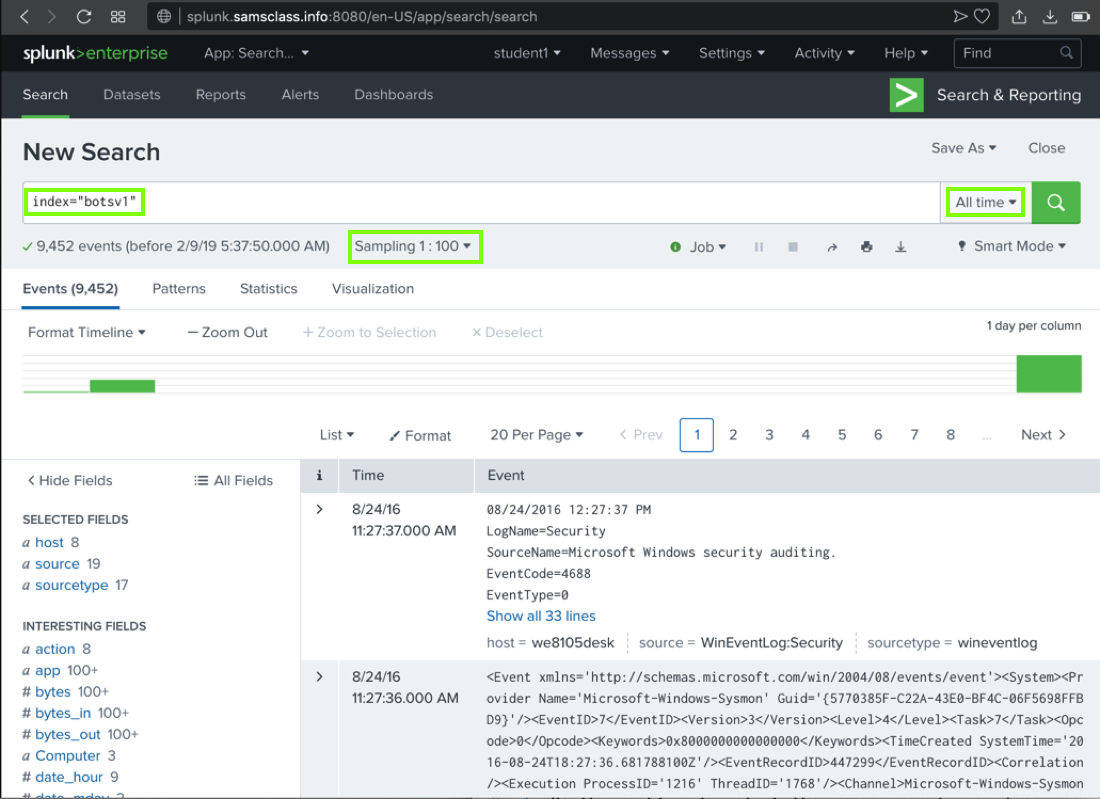
Do these steps:
- In the Search box, type
index="botsv1"
- On the right side, click the "Last 24 hours" box and click "All time"
- On the left side, under the Search box, click "No Event Sampling" and click "1: 100"
- On the right side, click the green magnifying-glass icon
The search finishes within a few seconds, and finds
approximately 9,452 results,
as shown below.
(The number varies because
the sampling is random.)
There are actually 100x as many events, but we are only
looking at 1% of them for now.
Viewing Sourcetypes
On the lower left, in the "SELECTED FIELDS" list,
click the blue sourcetype link.
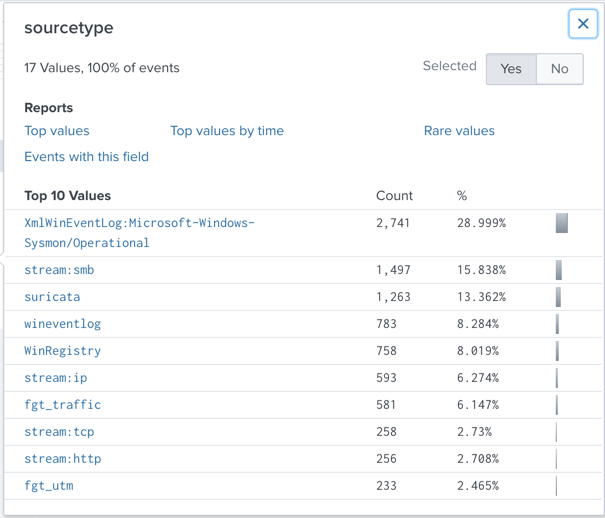
A "sourcetype" box pops up, showing the
"Top 10 Values" of this field,
as shown below.
Notice these items:
sourcetype
| | Sensor
|
|---|
| XmlWinEventLog:Microsoft-Windows-Sysmon/Operational | | "Sysmon", a Windows monitoring tool from Microsoft |
| stream:smb,stream:ip,stream:tcp,stream:http | | "Splunk Stream", which monitors live network traffic |
| suricata | | The Suricata Intrusion Detection System (IDS) |
| wineventlog and WinRegistry | | Windows OS |
| fgt_traffic and fgt_utm | | Fortigate firewalls |
Note: because the sampling is random, you may see
different items near the bottom of this list.
Viewing stream:http Events
In the "sourcetype" box,
in the "Top 10 Values" list,
near the bottom,
if it is visible,
click stream:http
Splunk adds
sourcetype="stream:http"
to
the search and finds approximately 252 results,
as shown below.
If there is no stream:http item in
the list, just type it into the query.
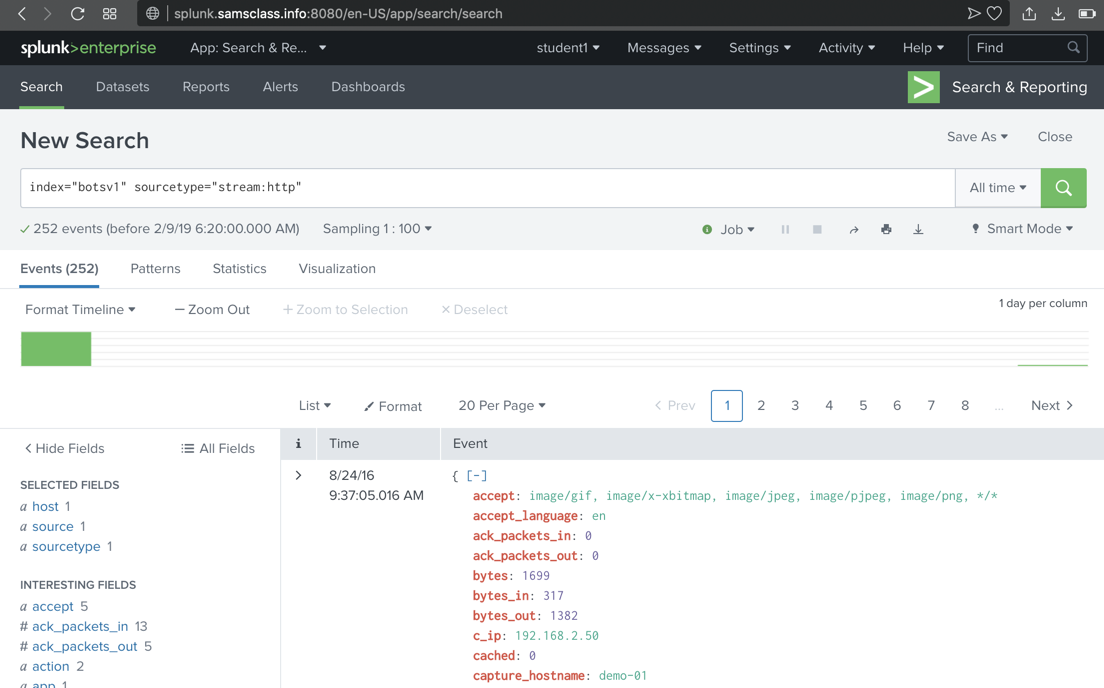
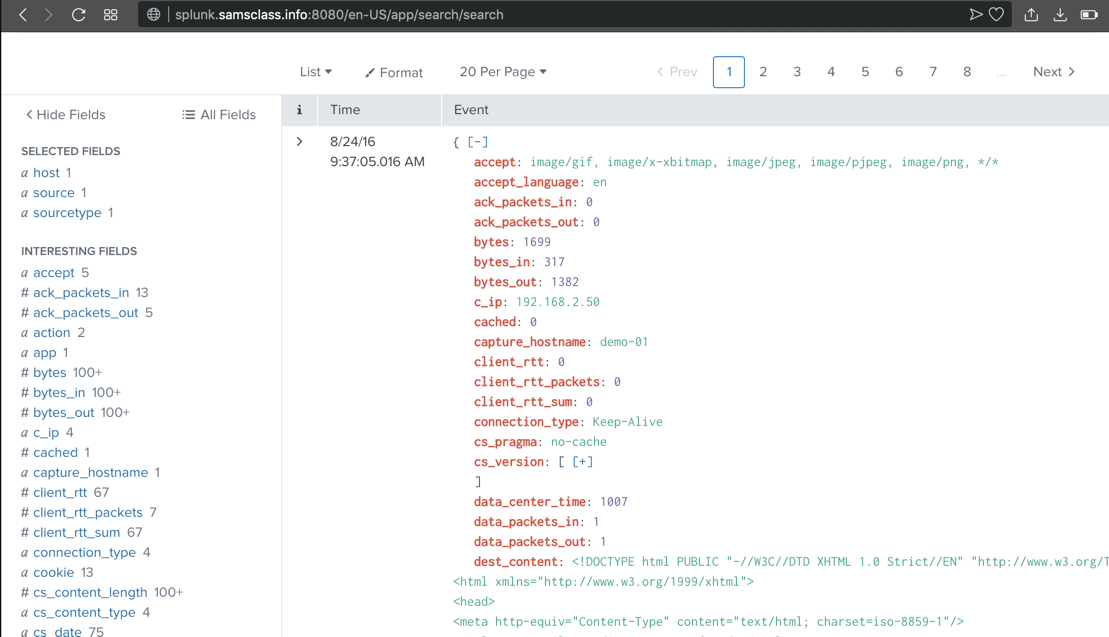
Scroll down to examine the most recent event.
Splunk has parsed this event into many fields,
shown in red, including c_ip,
the client IP address,
as shown below.
These fields are explained
here.
Viewing HTTP Events for imreallynotbatman.com
In the Search box, at the right end, add this text:
imreallynotbatman.com
251 events are found,
as shown below. (The sampling is
random, so you may not see the exact
events shown below.)
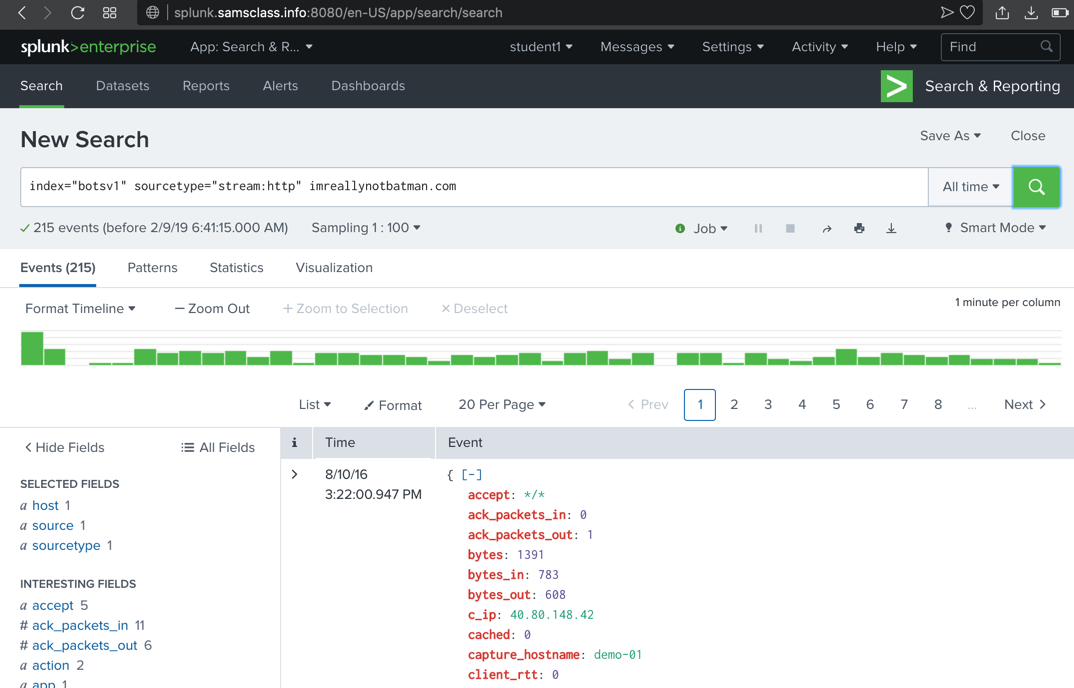
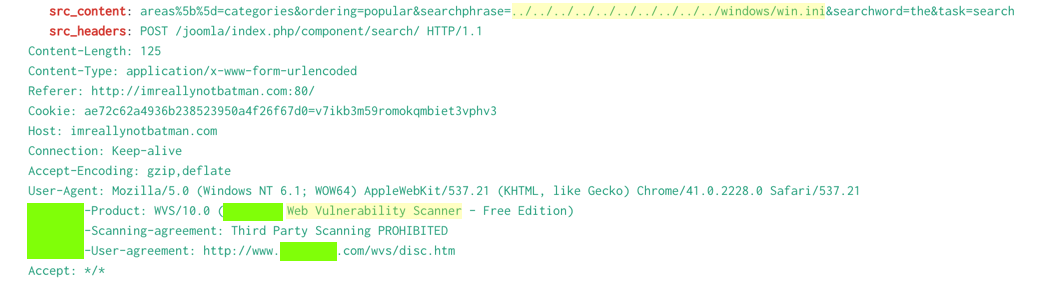
Scroll through the first few events found,
and note these items,
highlighted in the image below.
- You may see obvious attack URLs, such as the directory traversal path containing ../../../../ shown below.
- Many header fields reference a Web Vulnerability Scanner
Challenges
Find these items.
Use the forms
below to record your score in Canvas.
If you don't have a Canvas account, see
the instructions
here.
Posted 2-9-19