https://docs.microsoft.com/en-us/sysinternals/downloads/sysmon
Click "Download Sysmon".
Save the Sysmon.zip file in your Downloads folder.
At the bottom of your Windows desktop, click the yellow folder icon to open Windows explorer. Navigate to Downloads.
Right-click Sysmon. Click "Extract All...". Click Extract.
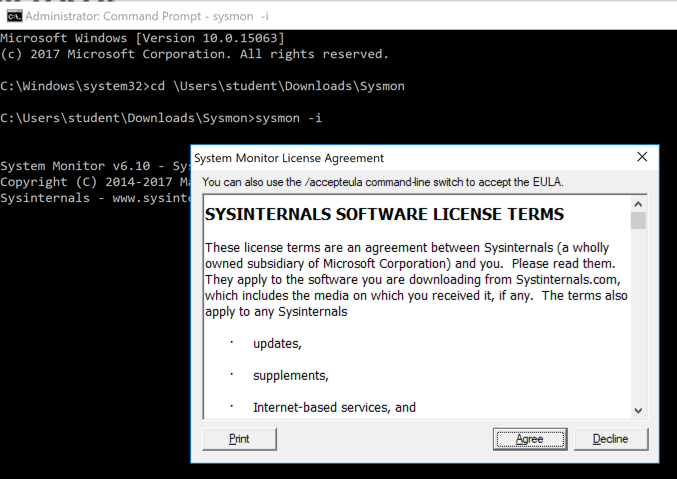
Click Start. Type CMD. Right-click "Command Prompt" and click "Run as Administrator".
In the User Account Control box, click Yes.
In the Command Prompt window, execute these commands, replacing "student" with your logon name.
cd \users\student\Downloads\Sysmon
sysmon -i
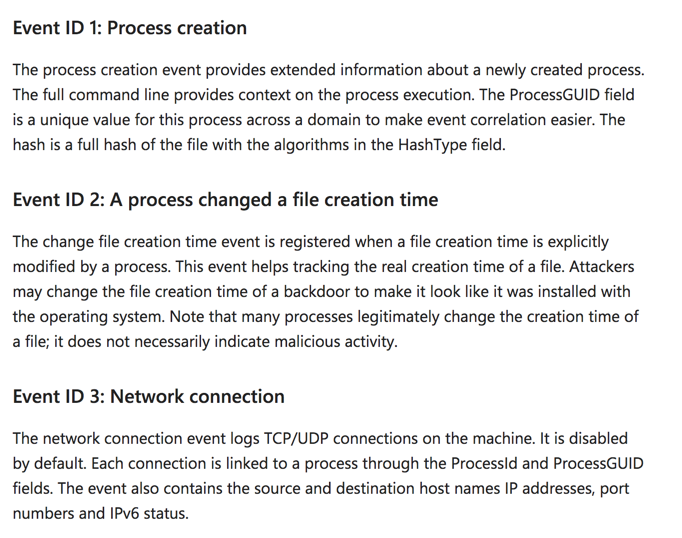
There are also events for registry changes.
localhost:8000
A Splunk login page appears, as shown below.
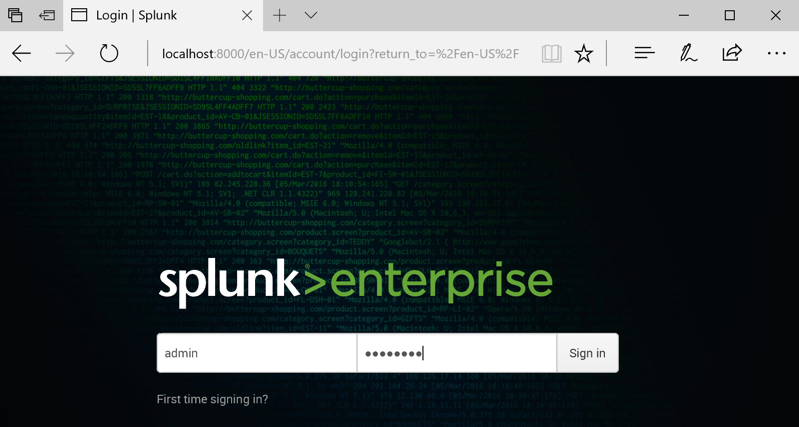
Log in. If you followed the steps in the previous tutorial, your credentials are admin and P@ssw0rd
https://splunkbase.splunk.com/app/1914/
At the top right, click "My Account".
Create a Splunk account if you don't have one.
Log in with your Splunk account.
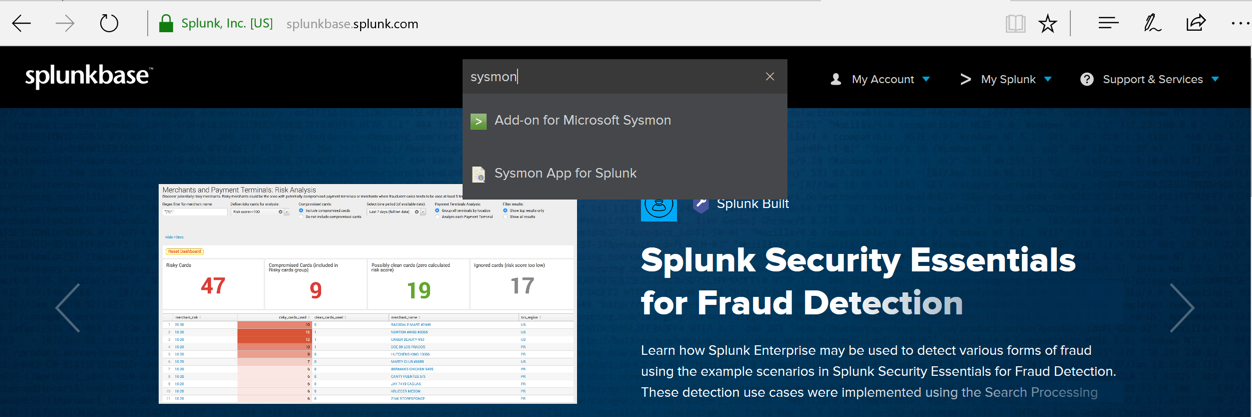
In the search box, type sysmon
Click "Add-on for Microsoft Sysmon", as shown below.
Click Download.
Accept the license agreement and click "Agree to Download".
Save the add-on-for-microsoft-sysmon_604.tgz file in your Downloads folder.
In the Splunk administration page, at the top left, click splunk.
At the top left, next to "Apps", click the tiny gear icon, as shown below.
Click "Install app from file".
In the "Upload a file" page, click the Browse... button.
Nagivate to your Downloads foler and click the add-on-for-microsoft-sysmon_604.tgz file.
Click Open.
Click Upload.
A message appears saying "App "Microsoft Sysmon Add-on" was installed successfully", as shown below.
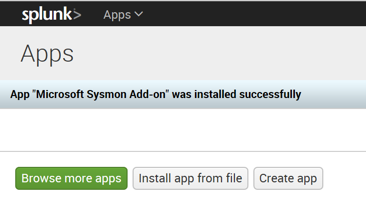
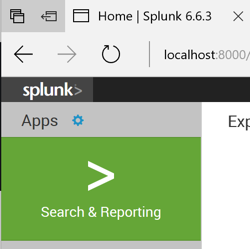
Click "Search & Reporting".
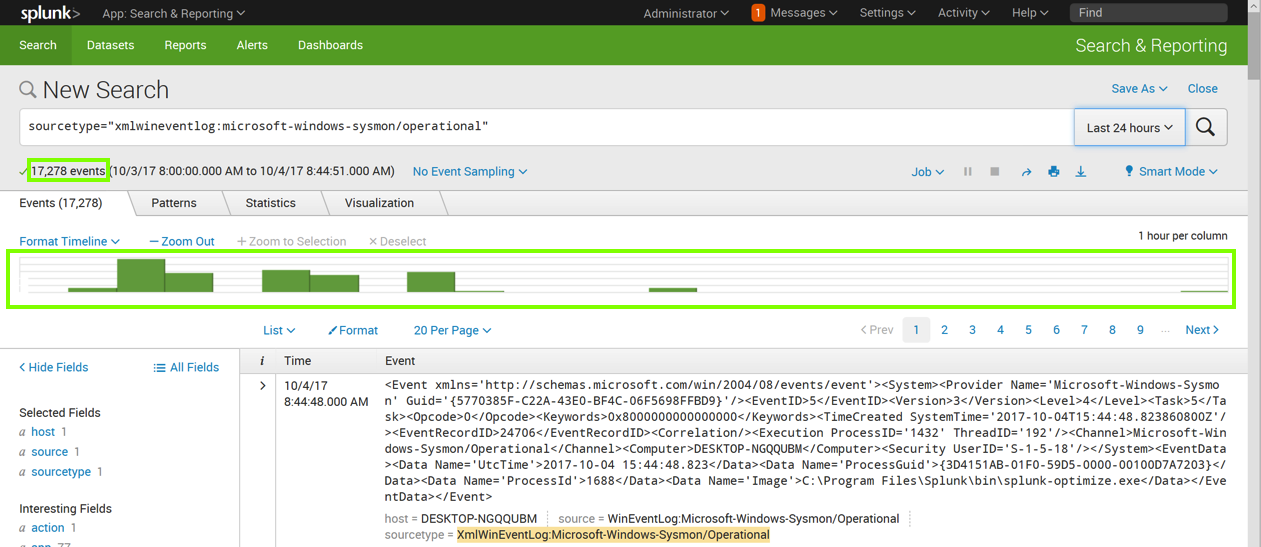
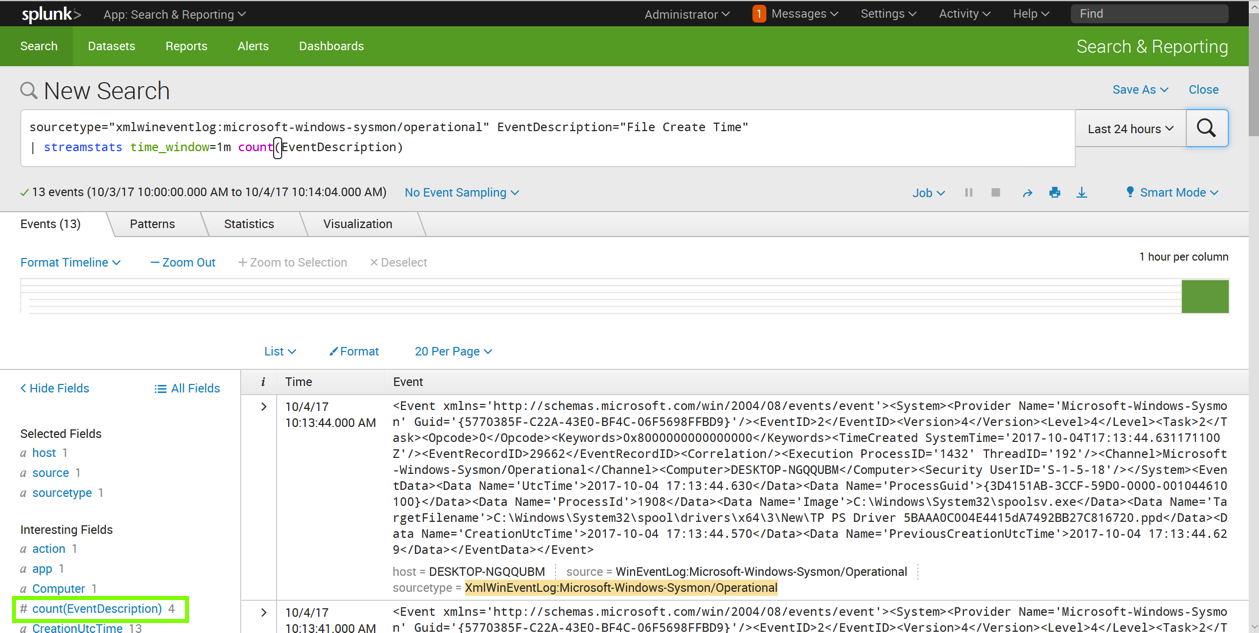
Enter this in the "New Search" field, as shown below. Click the magnifying glass icon on the right side.
sourcetype="xmlwineventlog:microsoft-windows-sysmon/operational"
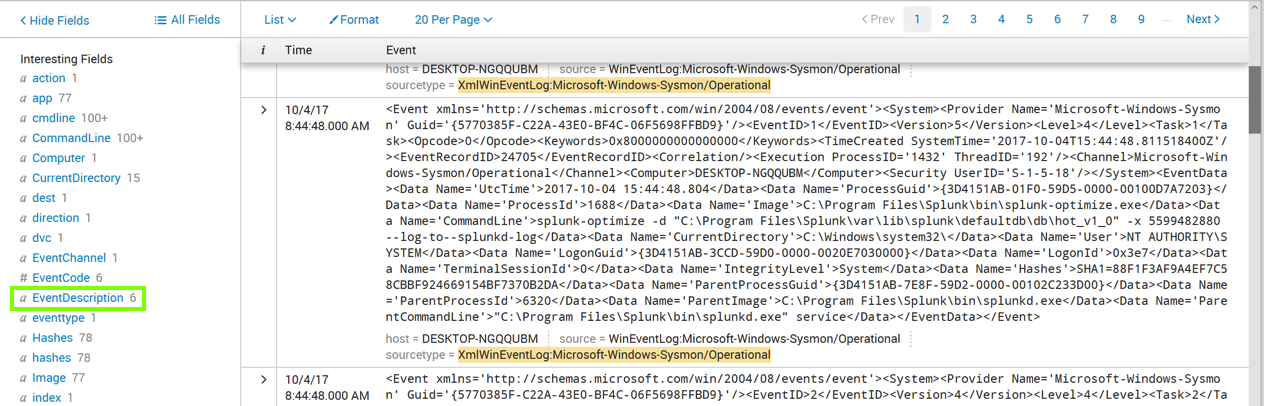
Click EventDescription, as outlined in green in the image above.
An "EventDescription" box pops up, showing how many events of each type were found, as shown below.
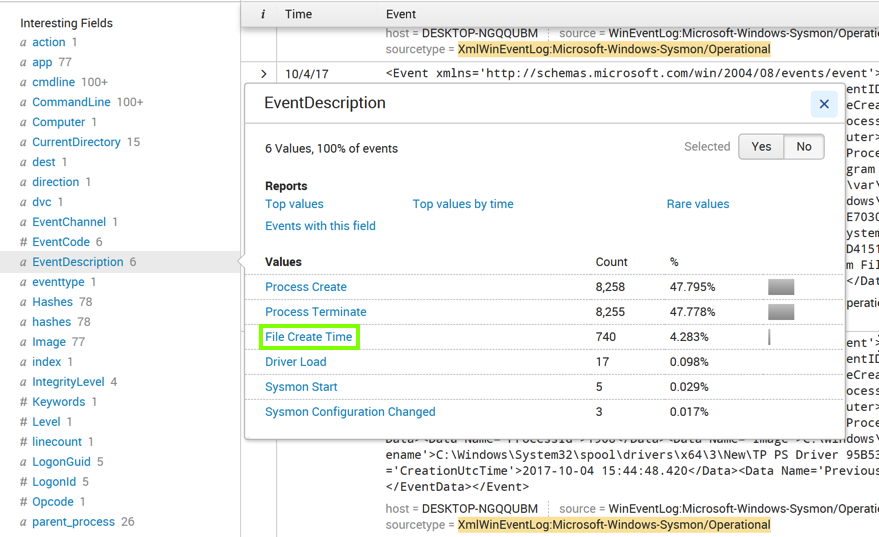
Click "File Create Time", as outlined in green in the image above.
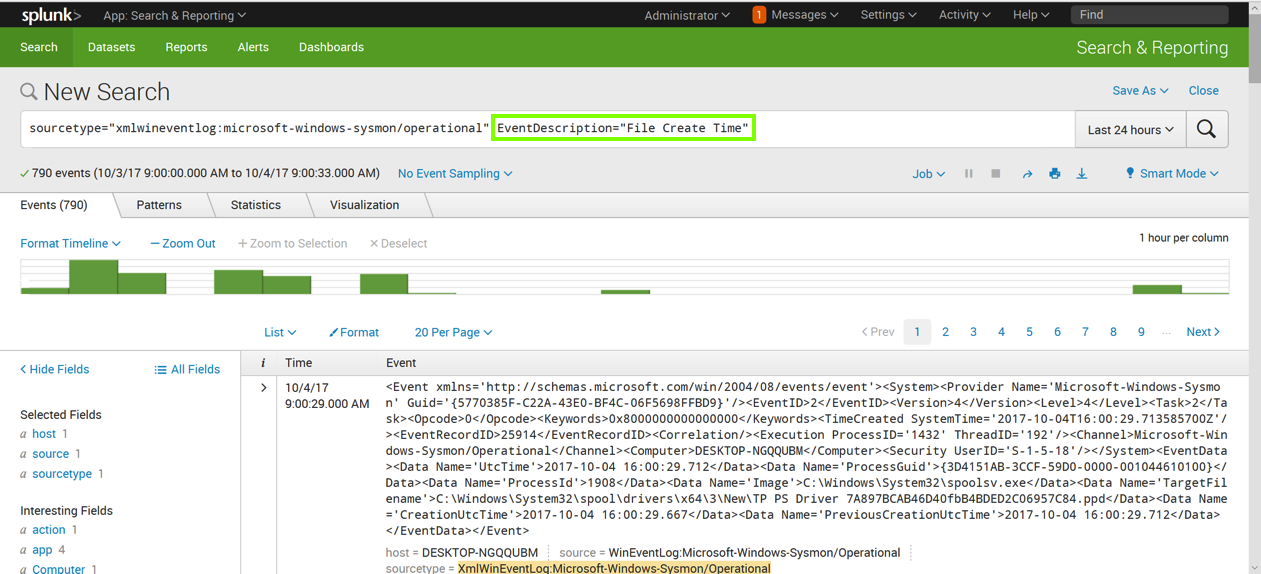
The Search page refreshes. Now the query is more specific, finding only events with EventDescription="File Create Time", as outlined in green in the image below.
Then add this line to the query, as shown below.
| streamstats count(EventDescription)
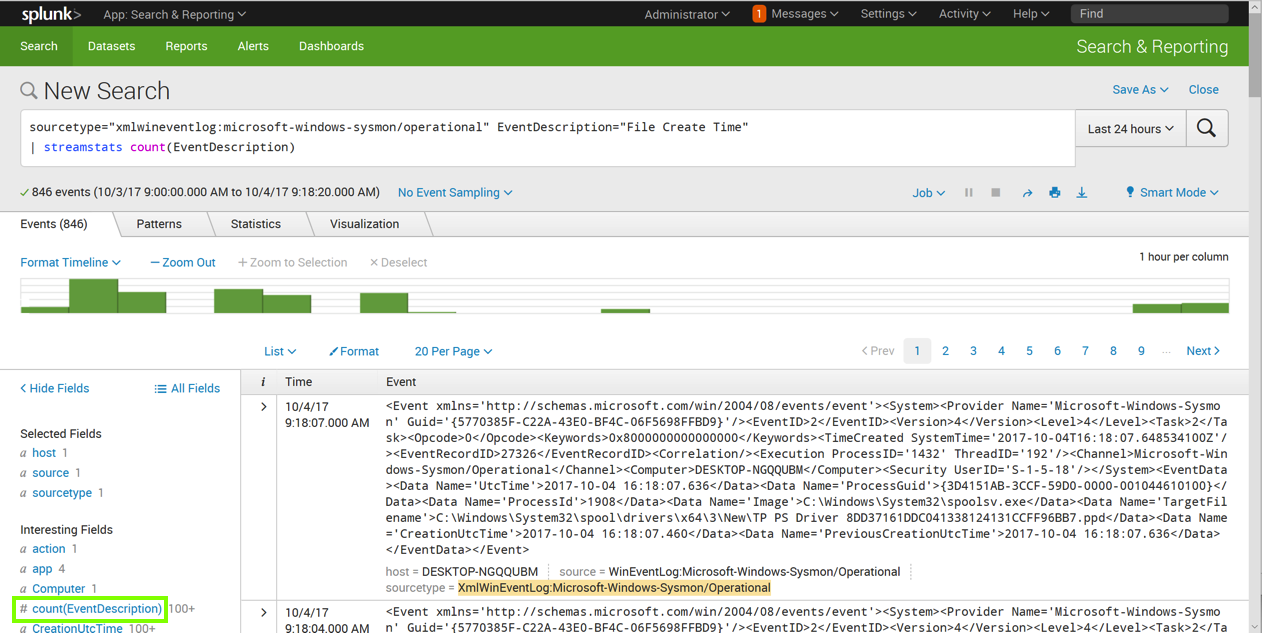
On the lower left, in the "Interesting Fields" section, click count(EventDescription).
A pop-up box appears, showing information about this field, as shown below.
Notice that the "Min" value is 1, and the "Max" value is equal to the total number of events, as shown below.
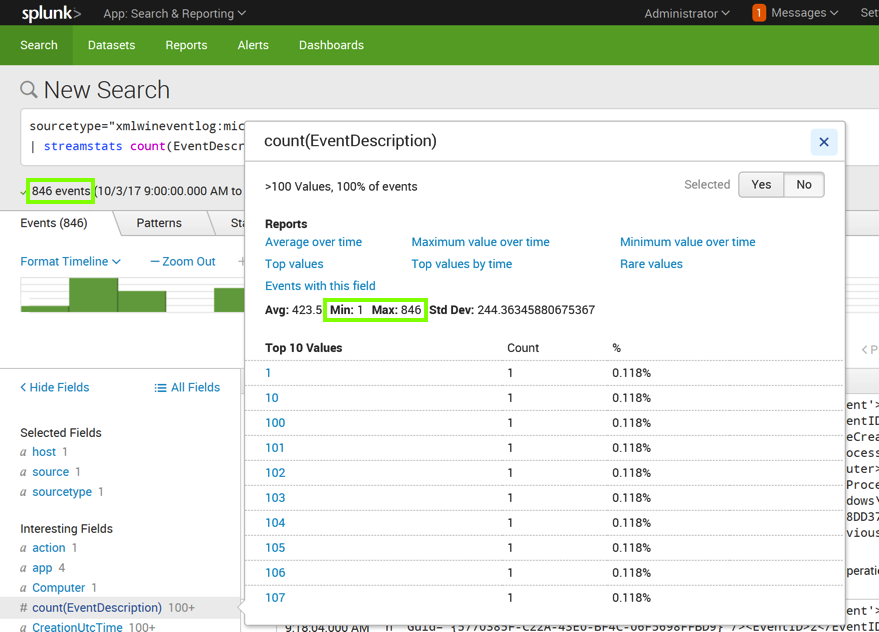
That's not very useful. To make it useful, we need to count events within a time interval, such as per minute.
Adjust your query to look like this, as shown below.
sourcetype="xmlwineventlog:microsoft-windows-sysmon/operational" EventDescription="File Create Time"
| streamstats time_window=1m count(EventDescription)
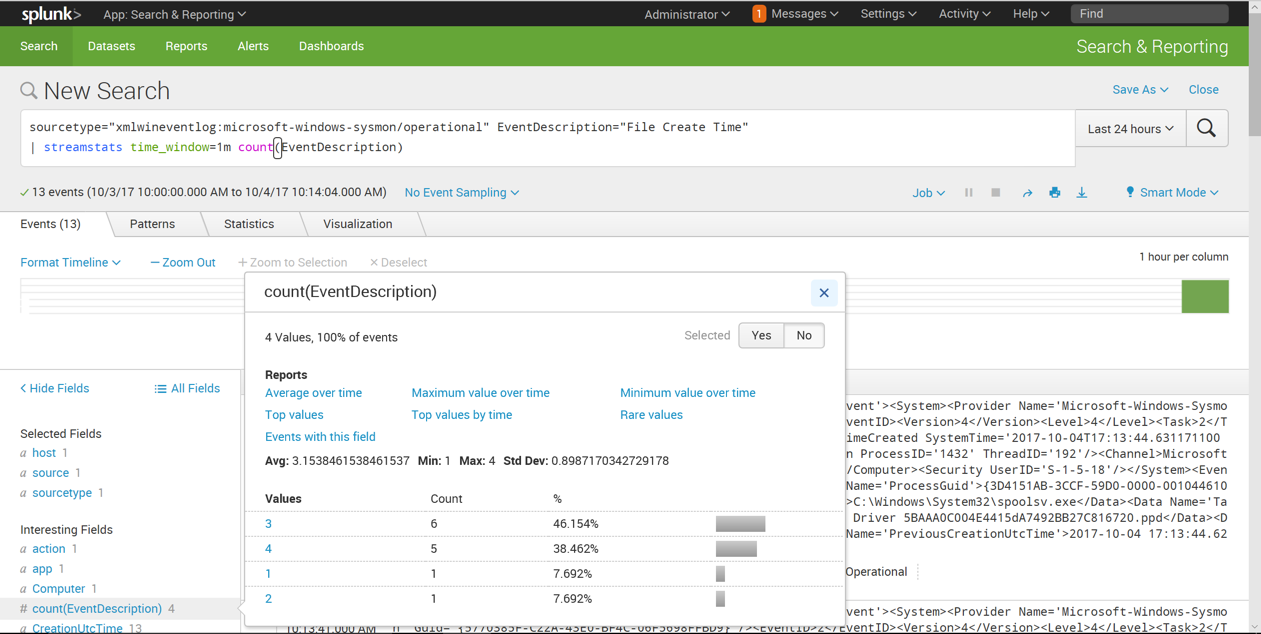
On the lower left, in the "Interesting Fields" section, click count(EventDescription).
A pop-up box appears, showing information about this field, as shown below.
It's common for 3 or 4 of these events to occur in a minute, but no larger numbers were visible in this sample.
In the Splunk administration page, at the top left, click splunk.
Click "Search & Reporting".
Enter this in the "New Search" field, as shown below. Click the magnifying glass icon on the right side.
sourcetype="xmlwineventlog:microsoft-windows-sysmon/operational" EventDescription="File Create Time"
| streamstats time_window=1m count(EventDescription) AS "new_files"
| search new_files > 10
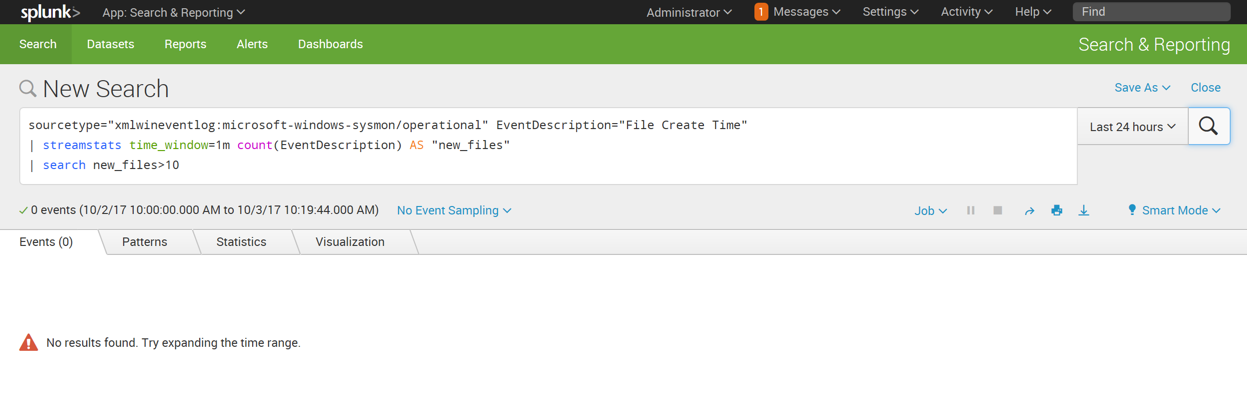
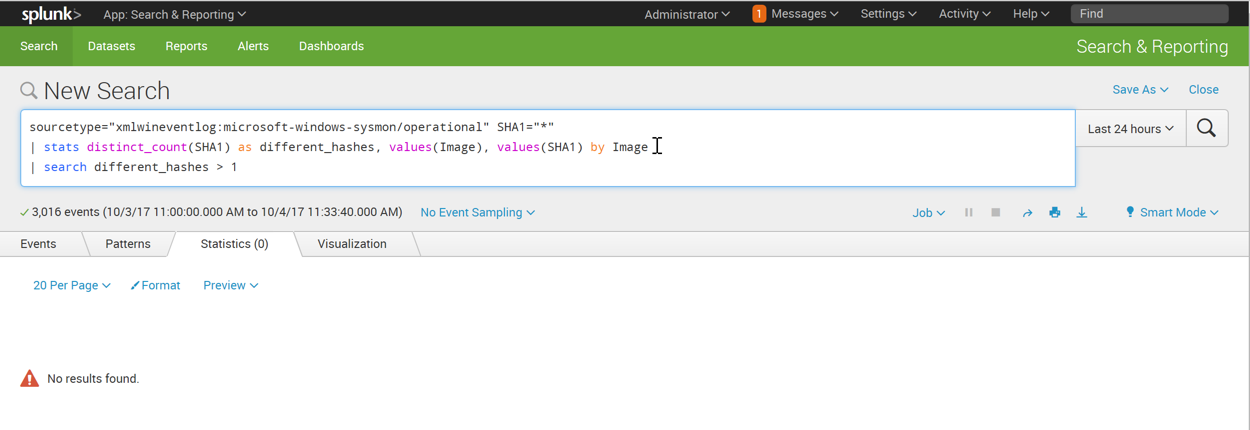
This search finds events in which more than 10 files are created in 1 minute. As shown above, there are no such events at the moment, so it reports "No results found".
https://samsclass.info/50/proj/12files.zip
Save the file in your Downloads folder.
At the bottom of your Windows desktop, click the yellow folder icon to open Windows explorer. Navigate to Downloads.
Right-click 12files and click "Extract All...". Click Extract, as shown below.
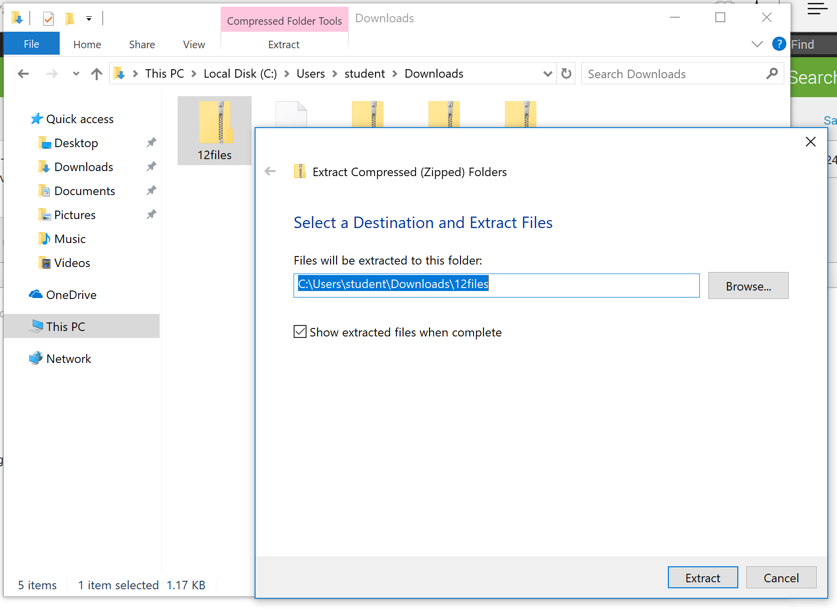
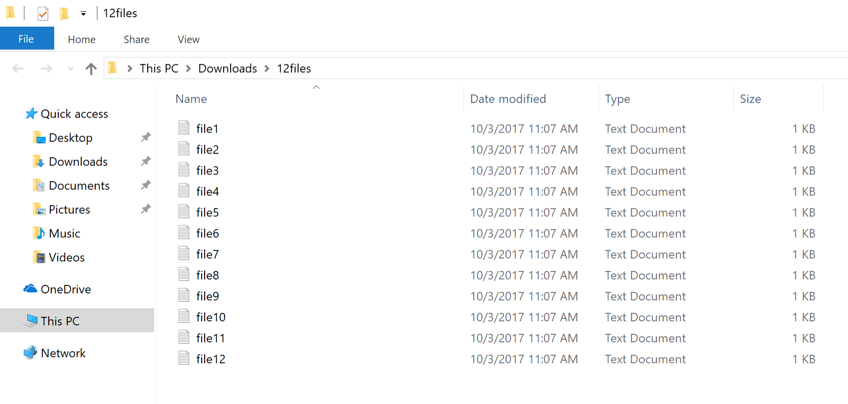
A "12files" window opens, as shown below.
Now events are found, as shown below.
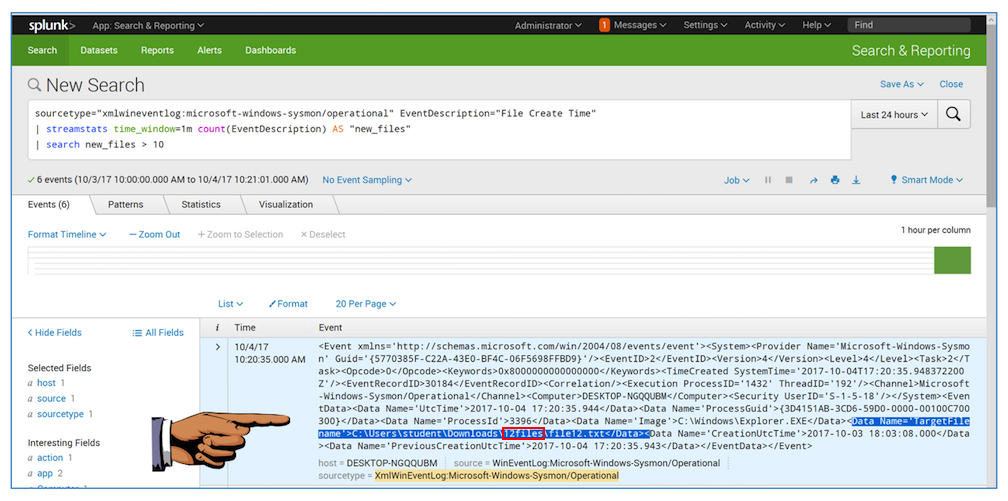
Notice that the details of the events shows a "Data Name='TargetFilename'" field with a value containing 12files, as outlined in red in the image above.
If there were the result of actual malware, the file path would probably be useful for identifying it.
Save a FULL DESKTOP image with the filename Proj 4a from Your Name.
sourcetype="xmlwineventlog:microsoft-windows-sysmon/operational"
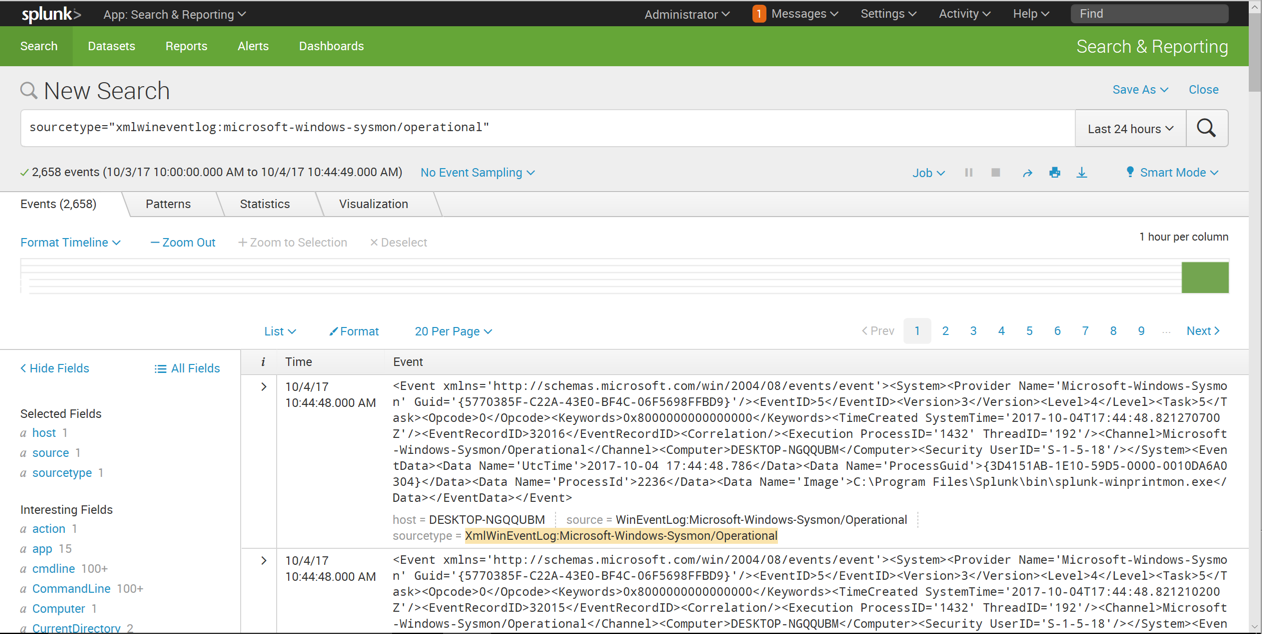
Click the Image field.
A box pops up showing the Top 10 Values, as shown below.
This field contains the full path for the executable that produced the event.
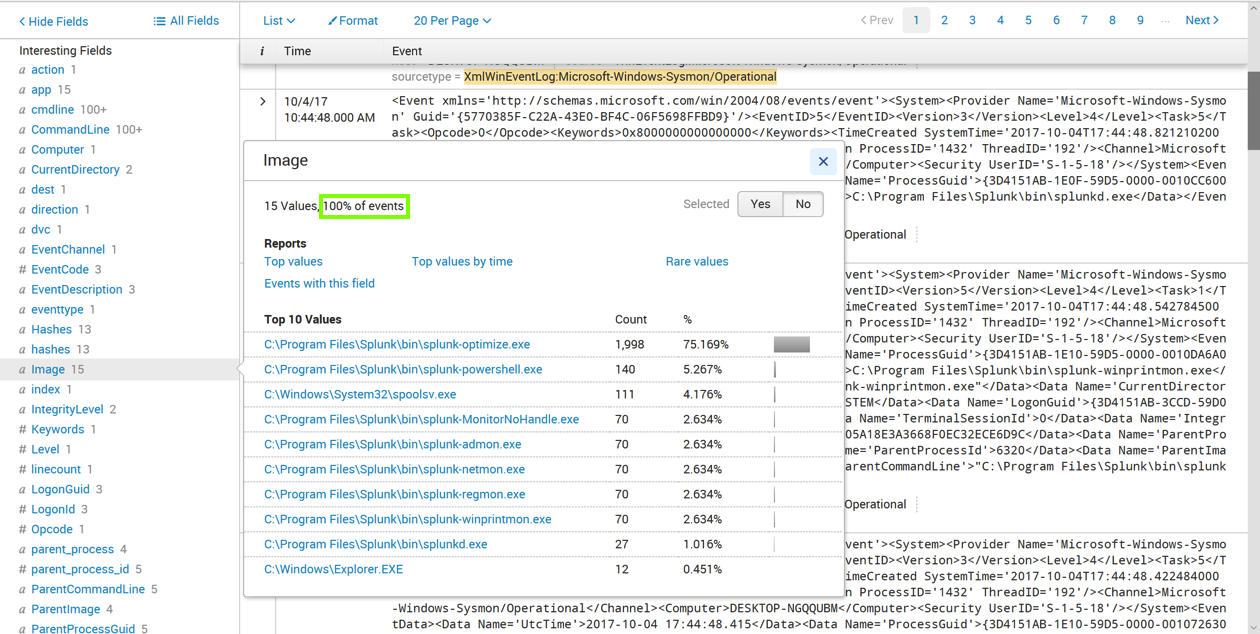
Notice the message outlined in green in the image above, saying "100% of events". This means that every Sysmon event contains this field.
Click the SHA1 field.
A box pops up showing the Top 10 Values, as shown below.
This field contains the SHA-1 hash for the executable that produced the event.
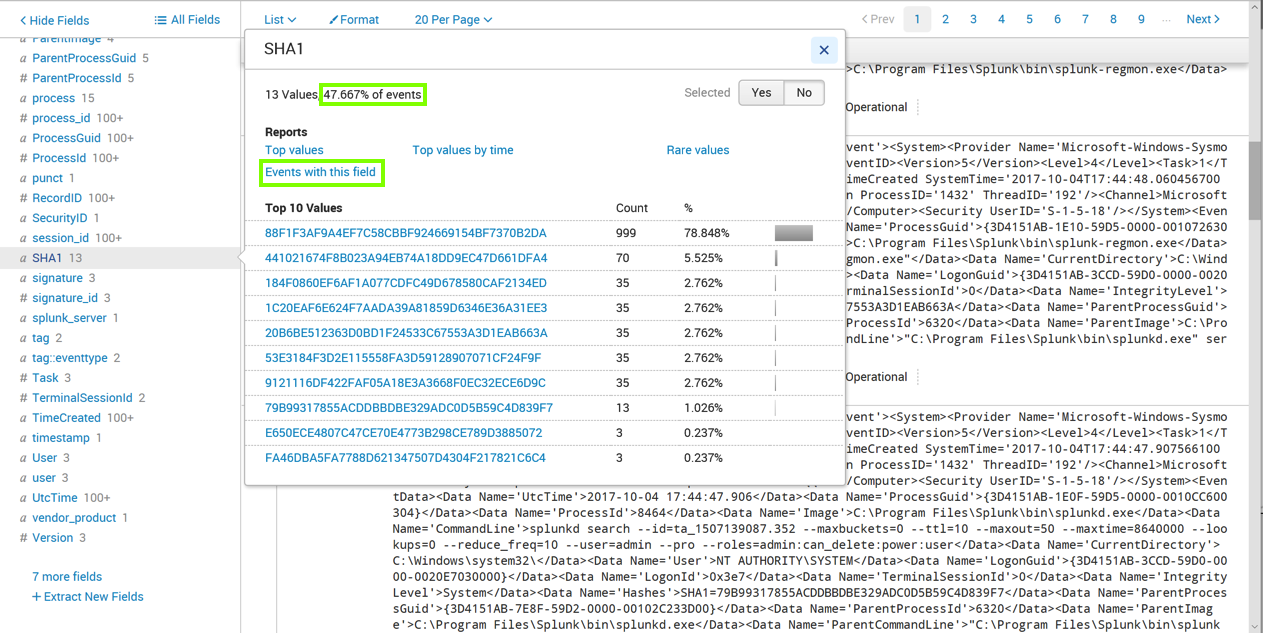
Notice the message outlined in green in the image above. It's less than 100%, because only some Sysmon events contain this field.
In the pop-up box, click "Events with this field", as outlined in green in the image above.
The page refreshes, showing only events containing SHA1, as shown below.
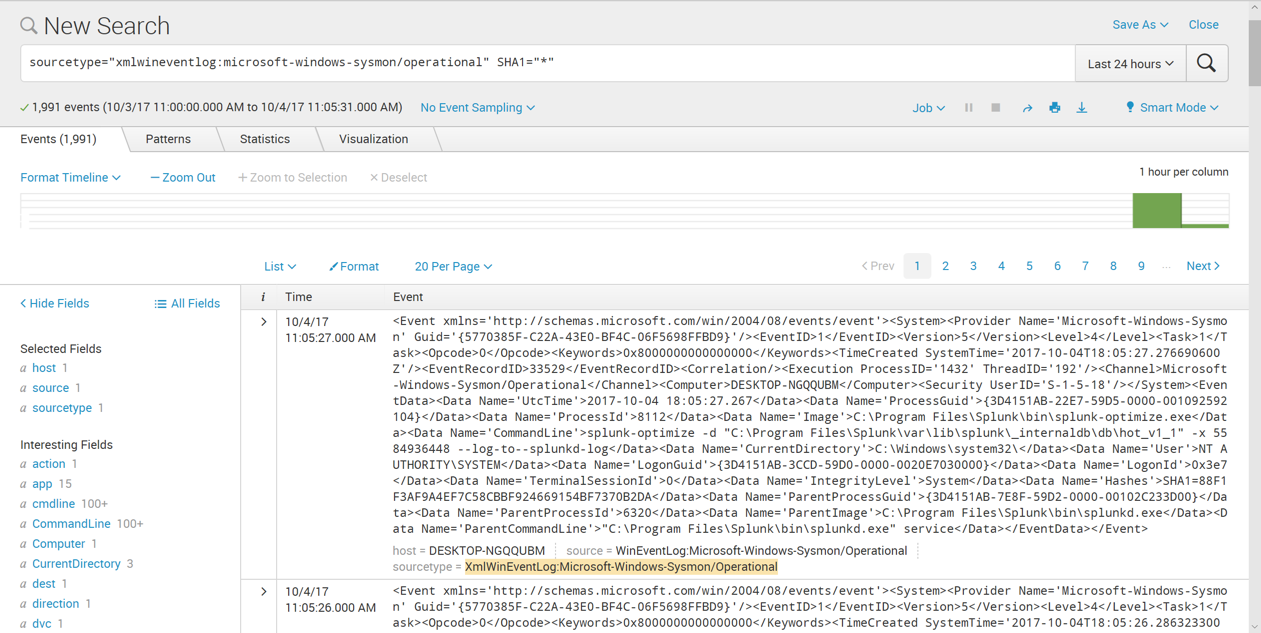
sourcetype="xmlwineventlog:microsoft-windows-sysmon/operational" SHA1="*"
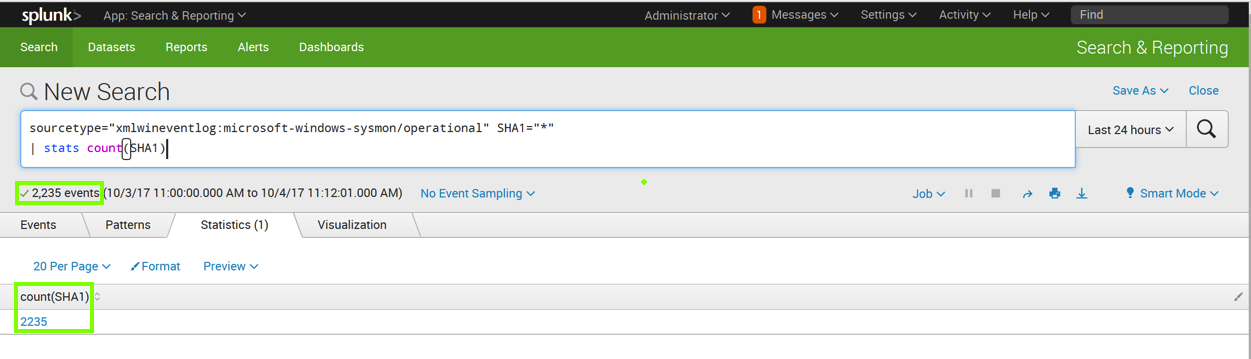
| stats count(SHA1)
This isn't much use.
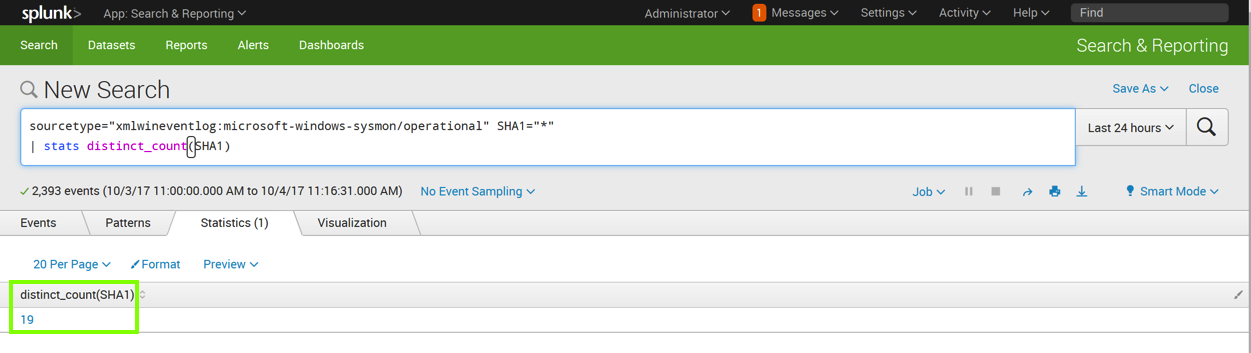
sourcetype="xmlwineventlog:microsoft-windows-sysmon/operational" SHA1="*"
| stats distinct_count(SHA1)
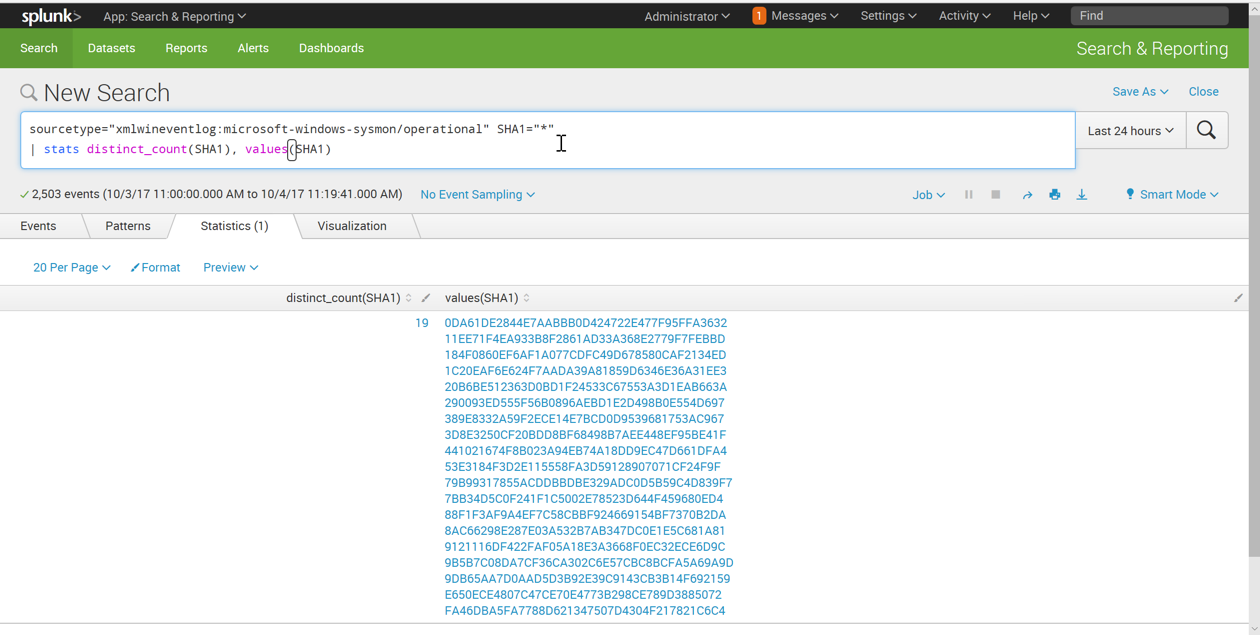
sourcetype="xmlwineventlog:microsoft-windows-sysmon/operational" SHA1="*"
| stats distinct_count(SHA1), values(SHA1)
sourcetype="xmlwineventlog:microsoft-windows-sysmon/operational" SHA1="*"
| stats distinct_count(SHA1), values(Image), values(SHA1)
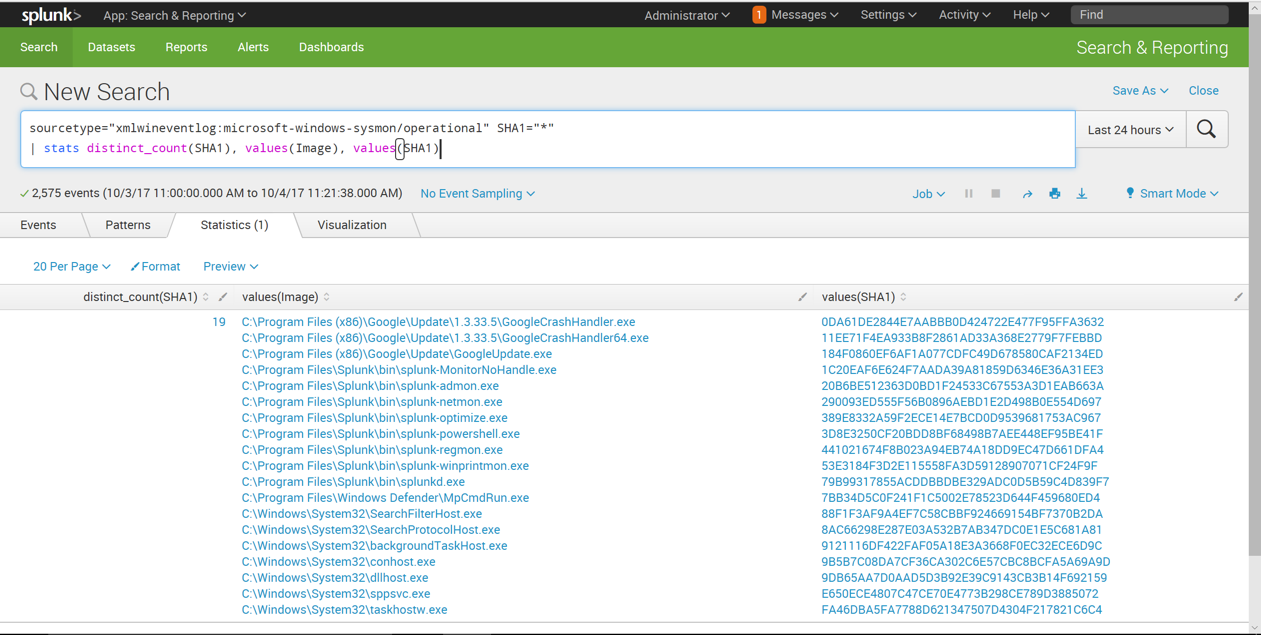
To do that, we need to group the results by Image.
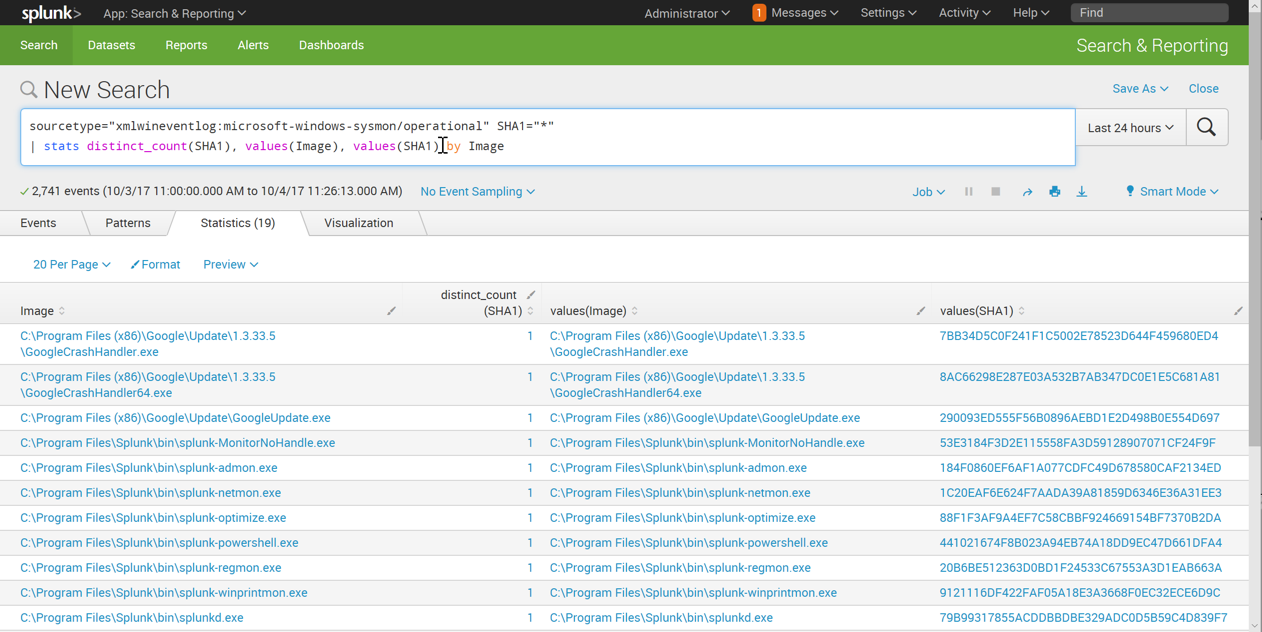
Enter this in the "New Search" field, as shown below. Click the magnifying glass icon on the right side.
sourcetype="xmlwineventlog:microsoft-windows-sysmon/operational" SHA1="*"
| stats distinct_count(SHA1), values(Image), values(SHA1) by Image
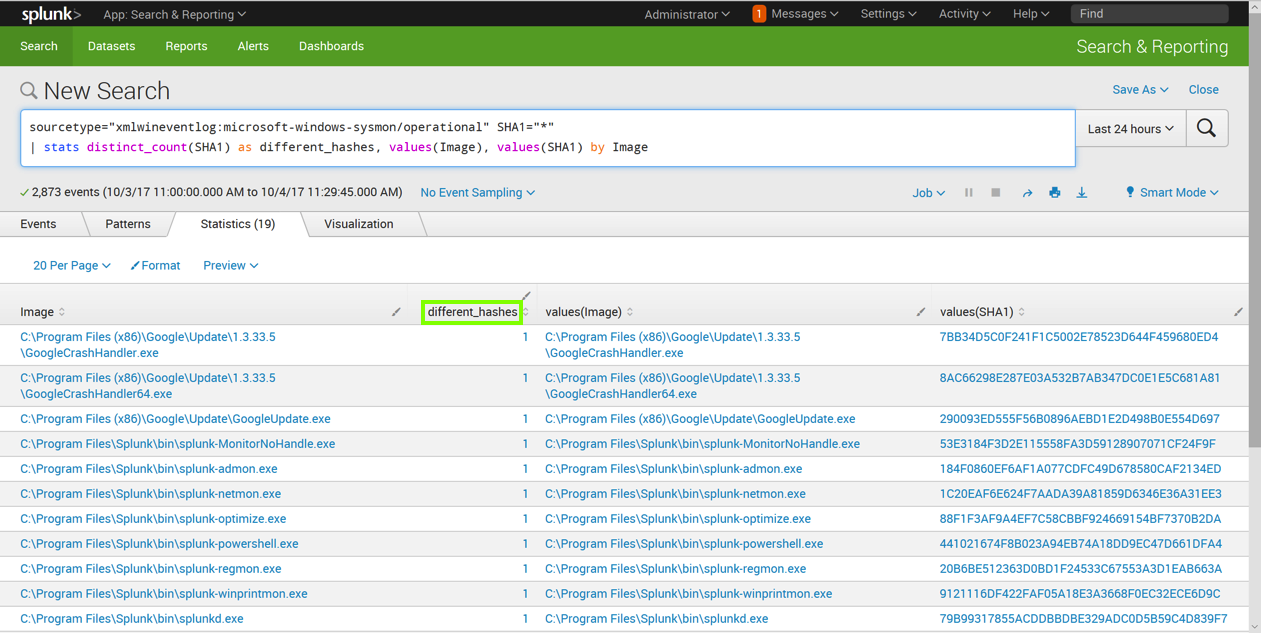
Enter this in the "New Search" field, as shown below. Click the magnifying glass icon on the right side.
sourcetype="xmlwineventlog:microsoft-windows-sysmon/operational" SHA1="*"
| stats distinct_count(SHA1) as different_hashes, values(Image), values(SHA1) by Image
Enter this in the "New Search" field, as shown below. Click the magnifying glass icon on the right side.
sourcetype="xmlwineventlog:microsoft-windows-sysmon/operational" SHA1="*"
| stats distinct_count(SHA1) as different_hashes, values(Image), values(SHA1) by Image
| search different_hashes > 1
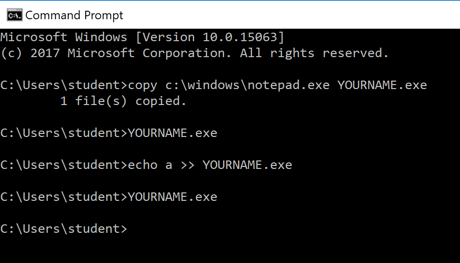
Execute these commands, replacing YOURNAME with your own name (without any spaces), as shown below.
These commands copy cmd.exe to your home folder, run it, modify it by adding an "a" to the end, and run it again.
copy c:\windows\notepad.exe YOURNAME.exe
YOURNAME.exe
echo a >> YOURNAME.exe
YOURNAME.exe
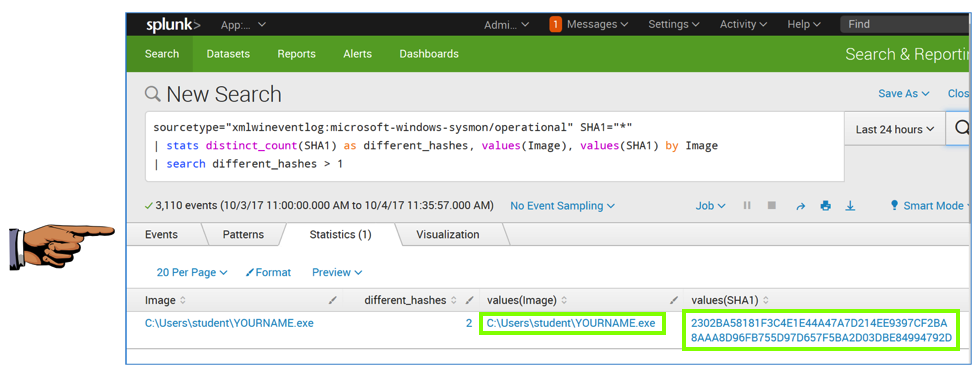
It finds the file with your name on it, with two different SHA1 values, as shown below.
On your Windows machine, in a Web browser, open this page:
https://github.com/SwiftOnSecurity/sysmon-config/blob/master/sysmonconfig-export.xml
Right-click the Raw button and click "Save Target As...". Save the sysmonconfig-export.xml file in your Downloads folder.
https://github.com/SwiftOnSecurity/sysmon-config/blob/master/sysmonconfig-export.xml
In the User Account Control box, click Yes.
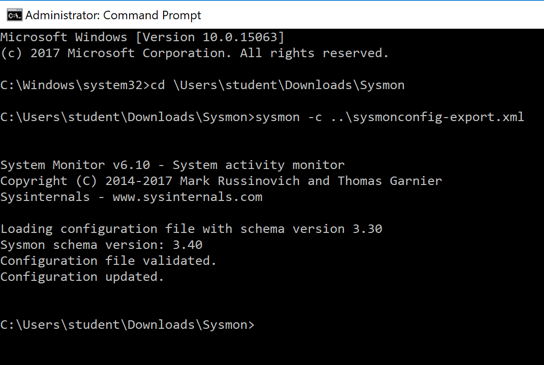
In the Command Prompt window, execute these commands, replacing "student" with your logon name.
cd \users\student\Downloads\Sysmon
sysmon -c ..\sysmonconfig-export.xml
In the search results, click regedit. In the User Account Control box, click Yes.
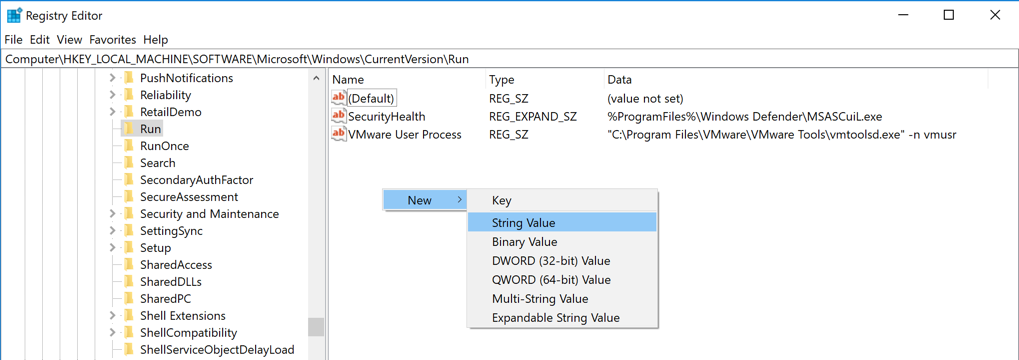
In Registry Editor, in the left pane, navigate to this key, as shown below.
HKEY_LOCAL_MACHINE\Software\Microsoft\Windows\CurrentVersion\Run
In the right pane, right-click an empty space and click New, "String Value", as shown below.
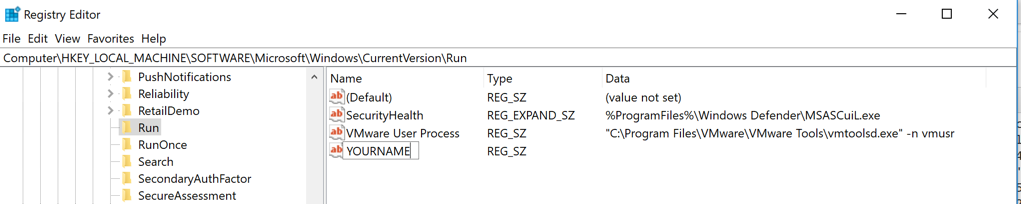
A new value appears, with its name highlighted. Type over the name, entering your name (without spaces), as shown below.
Press Enter.
Close Regedit.
sourcetype="xmlwineventlog:microsoft-windows-sysmon/operational"
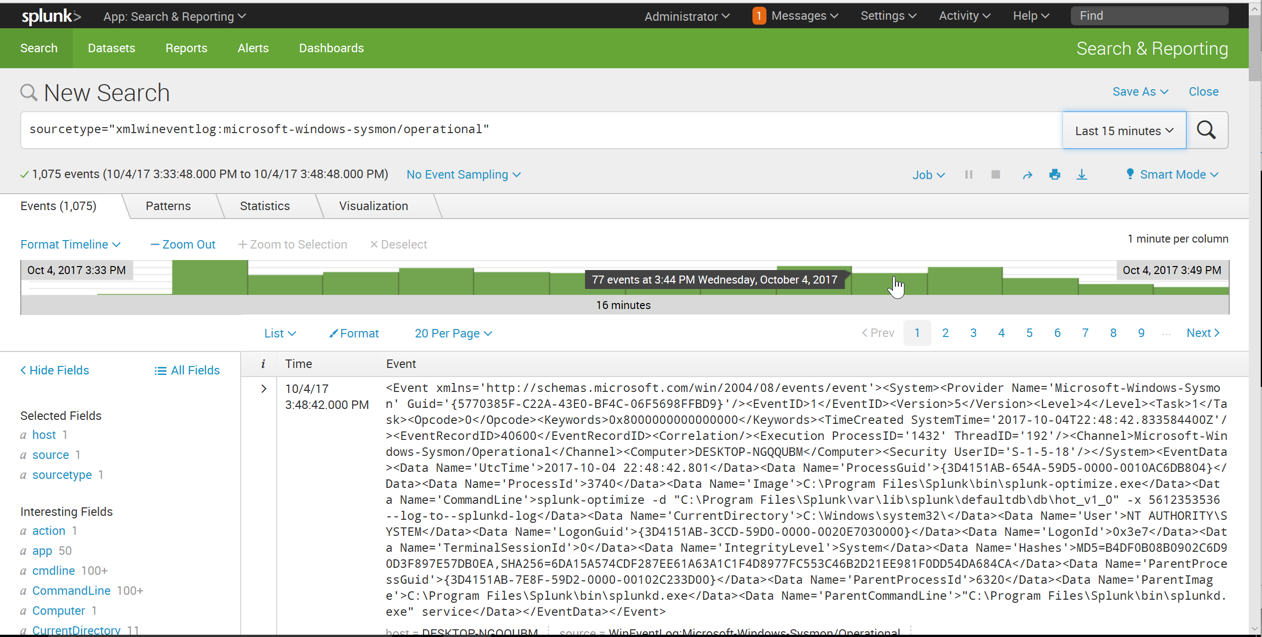
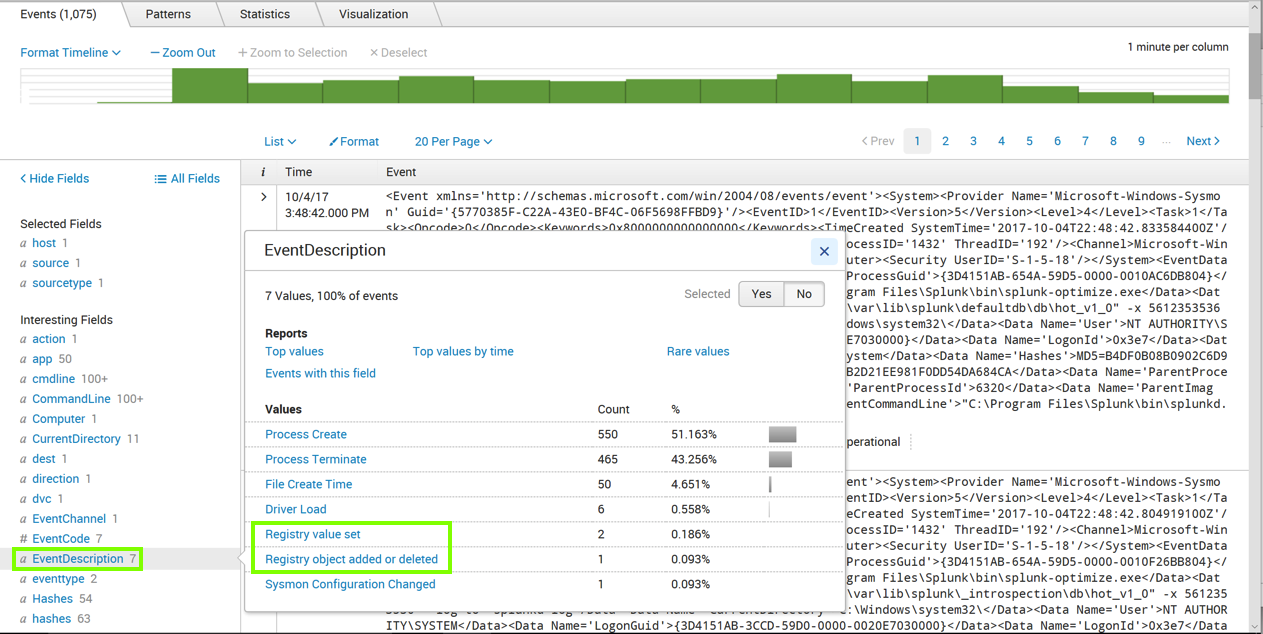
Click EventDescription, as outlined in green in the image above.
An "EventDescription" box pops up, showing how many events of each type were found, as shown above.
Notice the two events recording Registry actions. We want to search for them.
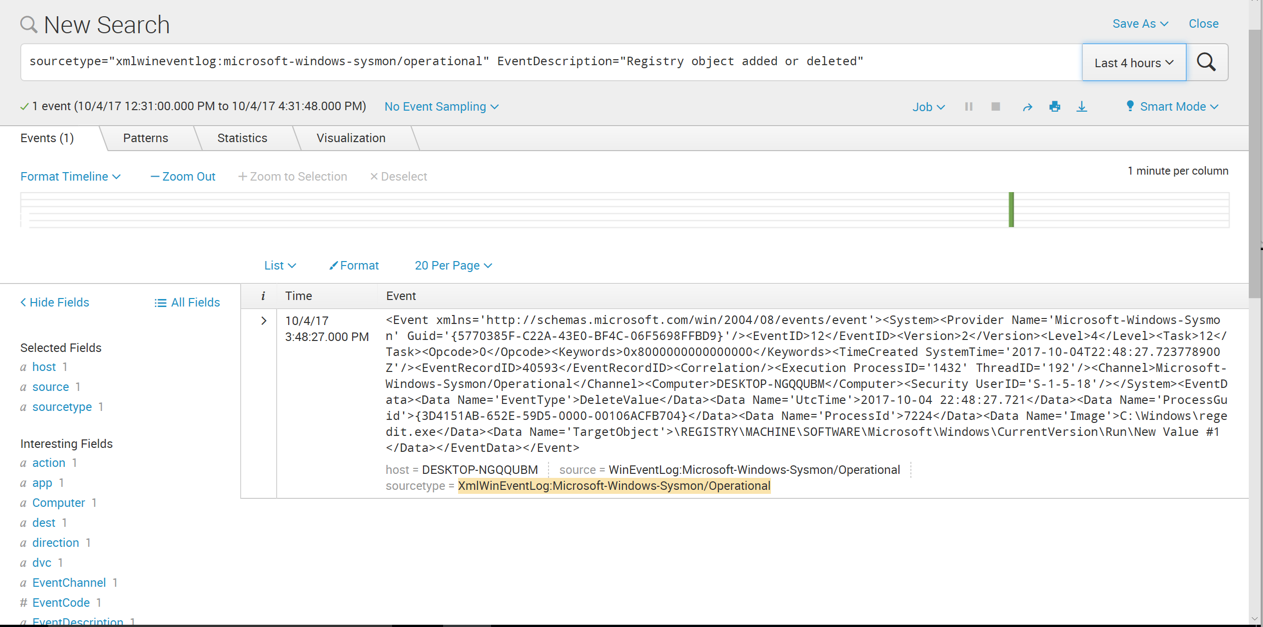
Click "Registry object added or deleted", as outlined in green in the image above.
The Search page refreshes. Now the query is more specific, finding only events with that EventDescription, as shown below.
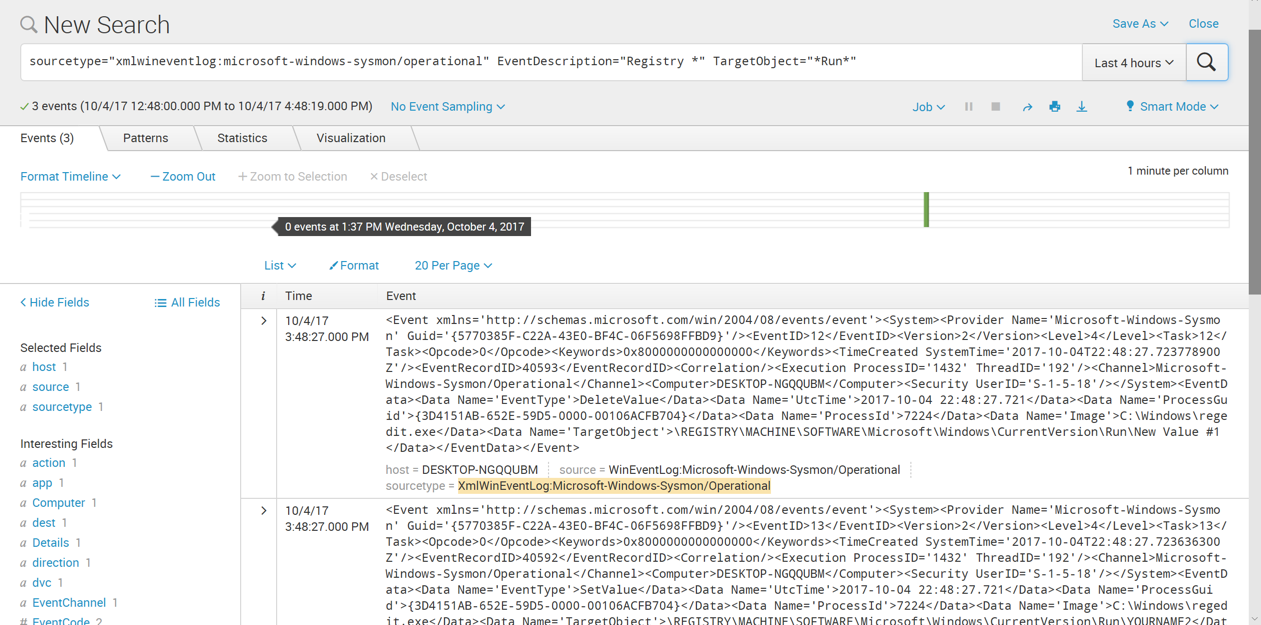
In the search query, remove all the text after "Registry" and replace it with a *, as shown below. Click the magnifying glass icon on the right side.
More events are found now.
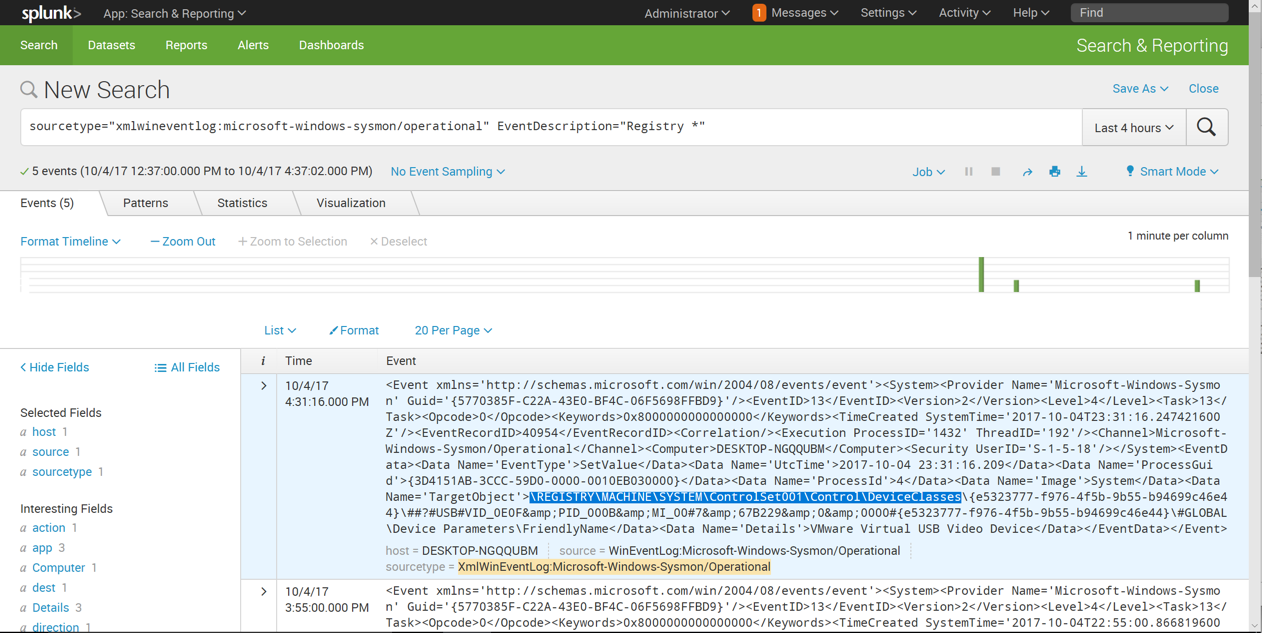
Notice the 'TargetObject' field, highlighted in the image above. We want to find log entries with "Run" in this field.
In the Splunk search page, scroll down to the "Interesting Fields" section on the left side of the page, as shown below.
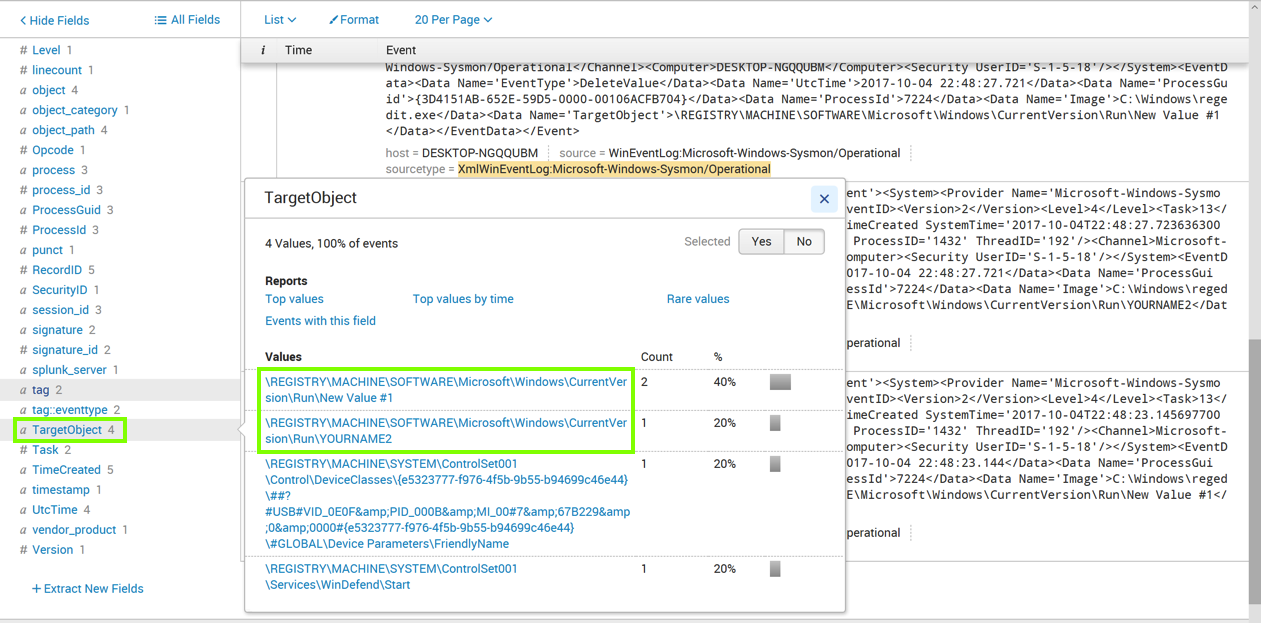
Click TargetObject, as outlined in green in the image above.
A "TargetObject" box pops up, showing how many events of each type were found, as shown above.
Notice the two events recording Registry Run key actions, outlined in green in the image above.
We want to search for them.
In the "TargetObject" box, click one of the registry paths containing "Run".
The Search page refreshes. Now the query is more specific, finding only events with that TargetObject, as shown below.
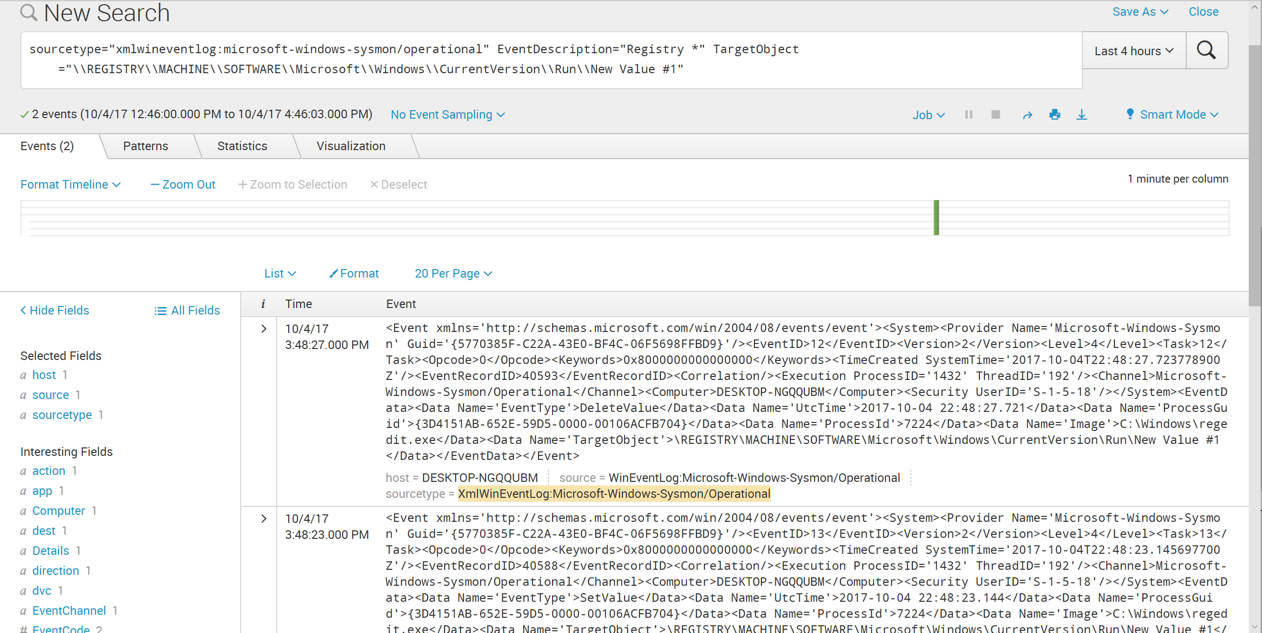
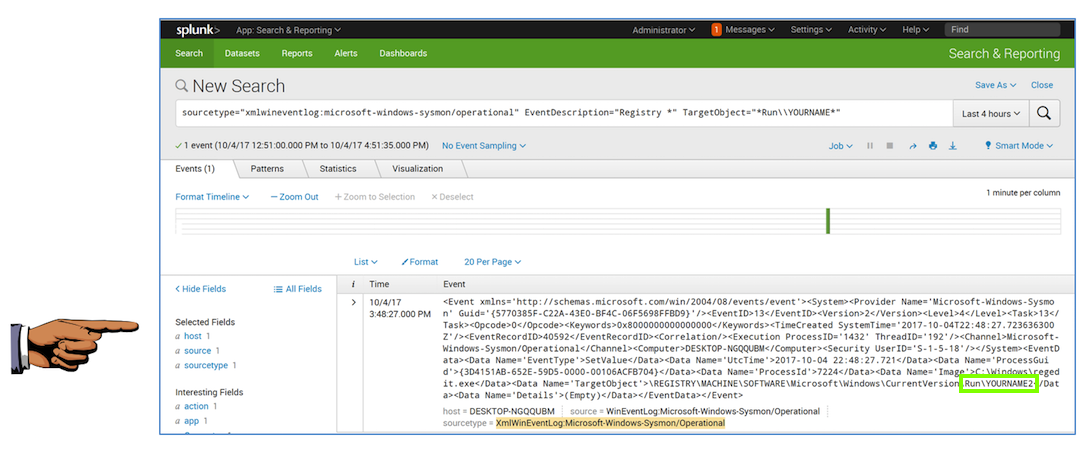
In the search query, remove all the text in the TargetObject pattern except "Run", and replace it with a * before and after "Run", as shown below. Click the magnifying glass icon on the right side.
More events are found now.
Th event containing your name appears, as shown below.
Save a FULL DESKTOP image with the filename Proj 4c from Your Name.