This project is based on this tutorial:
Jupyter Notebook Server
This project uses the SecML library, which hasn't been updated since 2023. It no longer works in Google Colab. Instead, you need to use a local virtual machine running an older Jupyter Notebook.See project ML 107 to see how to download and run that machine.
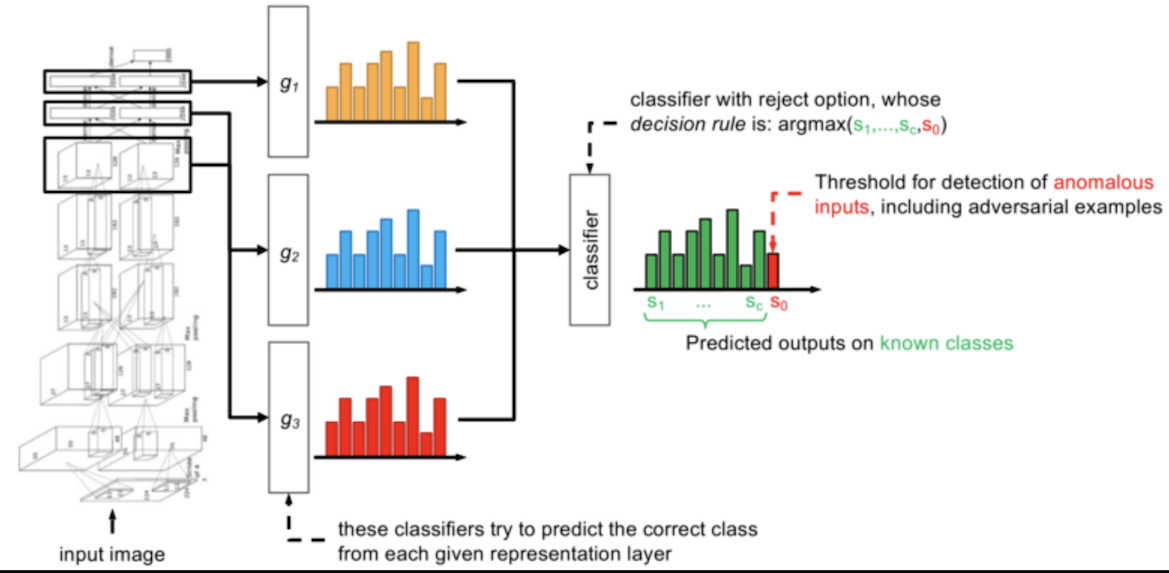
The figure below represents this process. Note these features:
Log in with a username of debian and a password of debian
Execute this command to see the server's IP address:
ip a
ssh debian@192.168.121.181
In the SSH window, execute these commands, one at a time:
sudo apt update
sudo apt install git -y

git clone https://gitlab.com/secml/secml.git
cp secml/src/secml/data/loader/c_dataloader_pytorch.py secml/src/secml/data/loader/c_dataloaderpytorch.py

pip install secml
pip install torch
pip install torchvision
They also download a pre-trained model, which we call "dnn" for Deep Neural Network.
import secml
import torch
from secml.array import CArray
from secml.data.loader import CDataLoaderMNIST
from secml.data.selection import CPSRandom
from secml.data.splitter import CDataSplitterShuffle
# load MNIST training set and divide it in two parts
tr_data = CDataLoaderMNIST().load(ds='training')
tr_data.X /= 255.0
splitter = CDataSplitterShuffle(num_folds=1, train_size=0.5,
test_size=0.5, random_state=1)
splitter.compute_indices(tr_data)
# dnr training set, reduced to 5000 random samples
tr_set = tr_data[splitter.tr_idx[0], :]
tr_set = CPSRandom().select(dataset=tr_set, n_prototypes=5000, random_state=0)
# load test set
ts_set = CDataLoaderMNIST().load(ds='testing', num_samples=1000)
ts_set.X /= 255.0
from secml.model_zoo import load_model
# load from model zoo the pre-trained net
dnn = load_model("mnist-cnn")
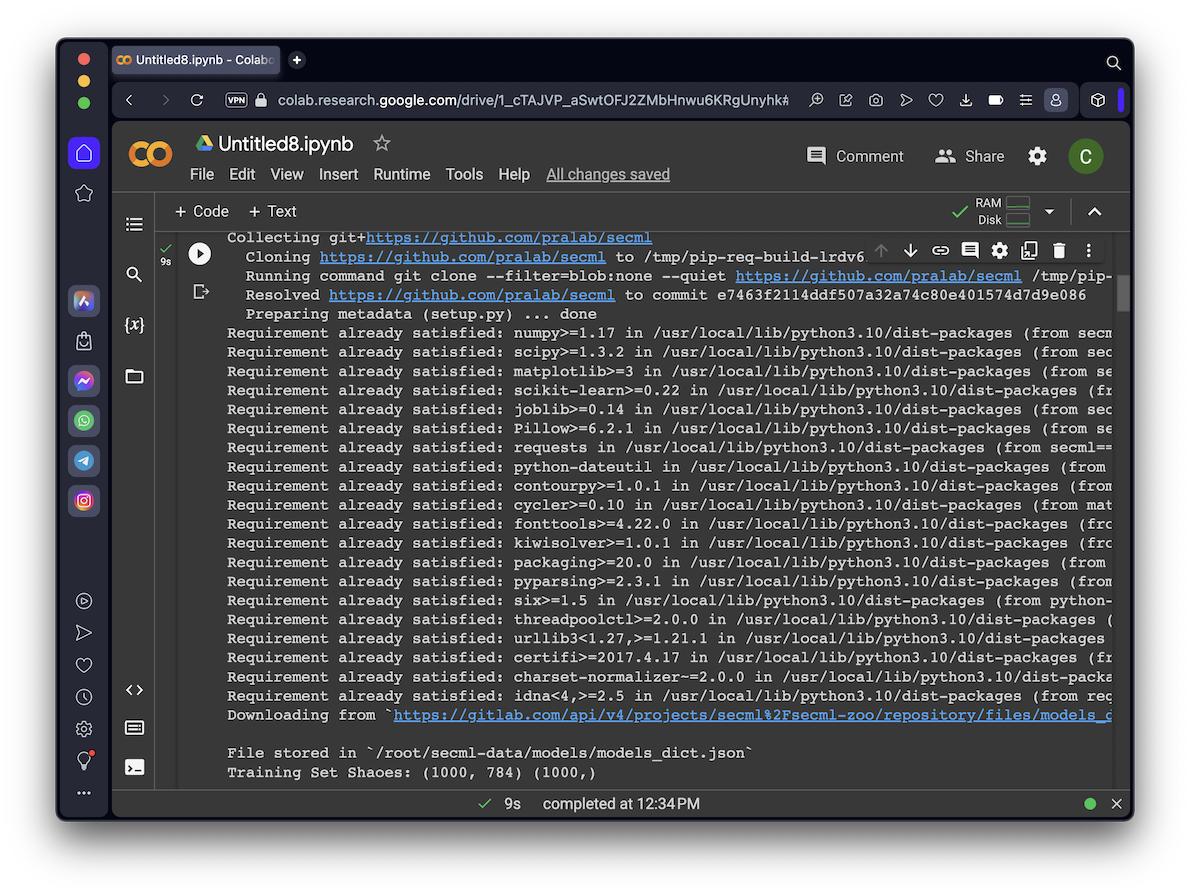
print( "Training Set Shapes:", ts_set.X.shape, ts_set.Y.shape )
The last line shows the "shape" of the test set:
from secml.figure import CFigure
# Only required for visualization in notebooks
%matplotlib inline
# Let's define a convenience function to easily plot the MNIST dataset
def show_digits_1(samples, labels, n_display):
samples = samples.atleast_2d()
n_display = min(n_display, samples.shape[0])
fig = CFigure(width=n_display*2, height=3)
for idx in range(n_display):
fig.subplot(2, n_display, idx+1)
fig.sp.xticks([])
fig.sp.yticks([])
fig.sp.imshow(samples[idx, :].reshape((28, 28)), cmap='gray')
fig.sp.title("{}".format(labels[idx].item()))
fig.show()
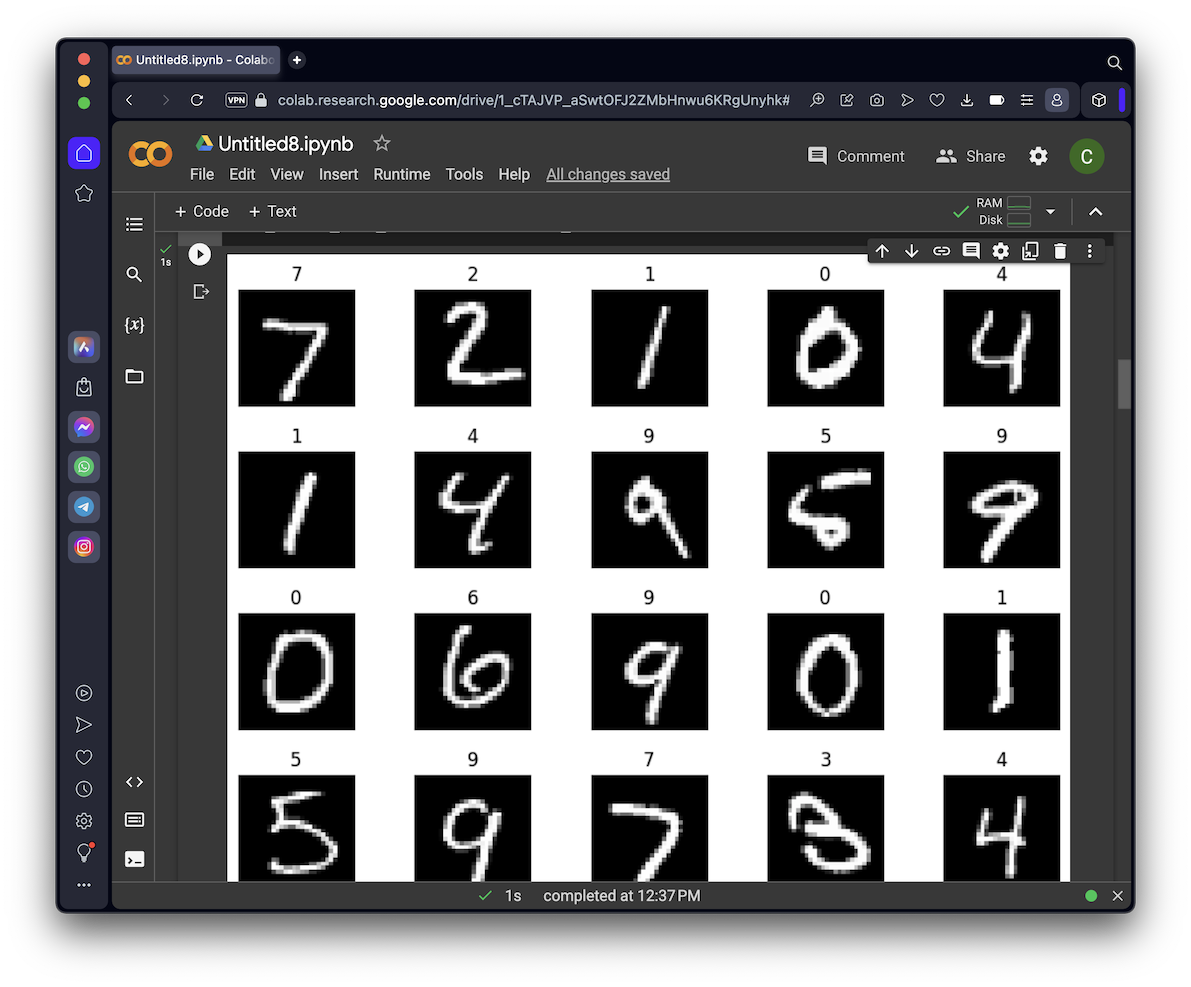
show_digits_1(ts_set.X, ts_set.Y, 5)
show_digits_1(ts_set[5:10, :].X, ts_set[5:10, :].Y, 5)
show_digits_1(ts_set[10:15, :].X, ts_set[10:15, :].Y, 5)
show_digits_1(ts_set[15:20, :].X, ts_set[15:20, :].Y, 5)
Execute this code:
print("Image, Prediction, Correct: \tScores")
print("", end = "\t")
for i in range(10):
print(" ", i, end="\t")
print()
for iter in range(20):
prediction, scores = dnn.predict(ts_set[iter, :].X, True)
p = prediction.get_data()[0]
y = ts_set[iter, :].Y.get_data()[0]
print(iter, p, y, end = ":\t")
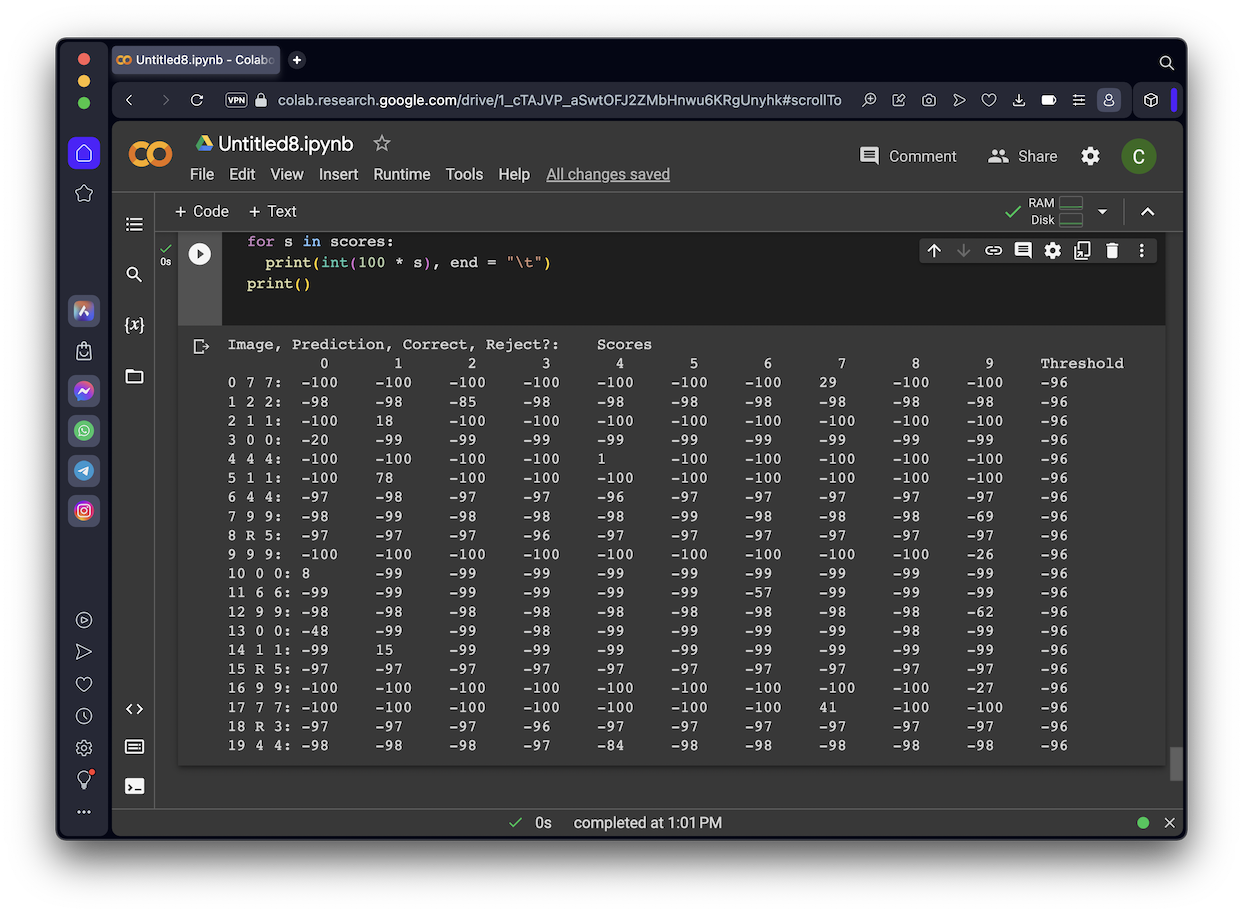
for s in scores:
print(int(100 * s), end = "\t")
print()
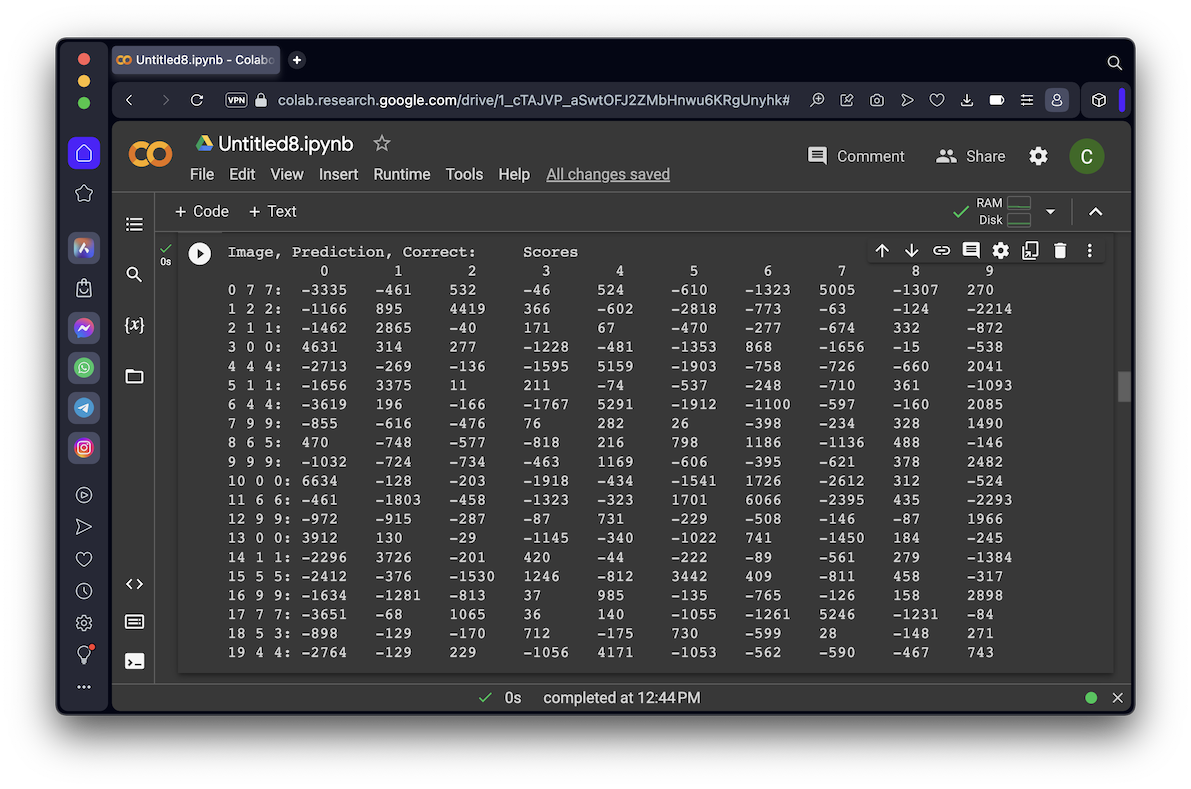
If the second and third numbers match, the model correctly classifies the image. As shown below, most of the images are correctly classified.
However, image #8 is really a 5, but is incorrectly classified as a 6 by the DNN model.
Also, image #18 is really a 3, but is incorrectly classified as a 5 by the DNN model.
from secml.adv.attacks import CAttackEvasionPGDExp
solver_params = {'eta': 1e-1, 'eta_min': 1e-1, 'max_iter': 40, 'eps': 1e-8}
pgd_exp = CAttackEvasionPGDExp(classifier=dnn, double_init_ds=tr_set, dmax=2,
distance='l2', solver_params=solver_params)
print("Running attack...")
eva_y_pred, _, eva_adv_ds, _ = pgd_exp.run(x=ts_set[0:20, :].X, y=ts_set[0:20, :].Y)
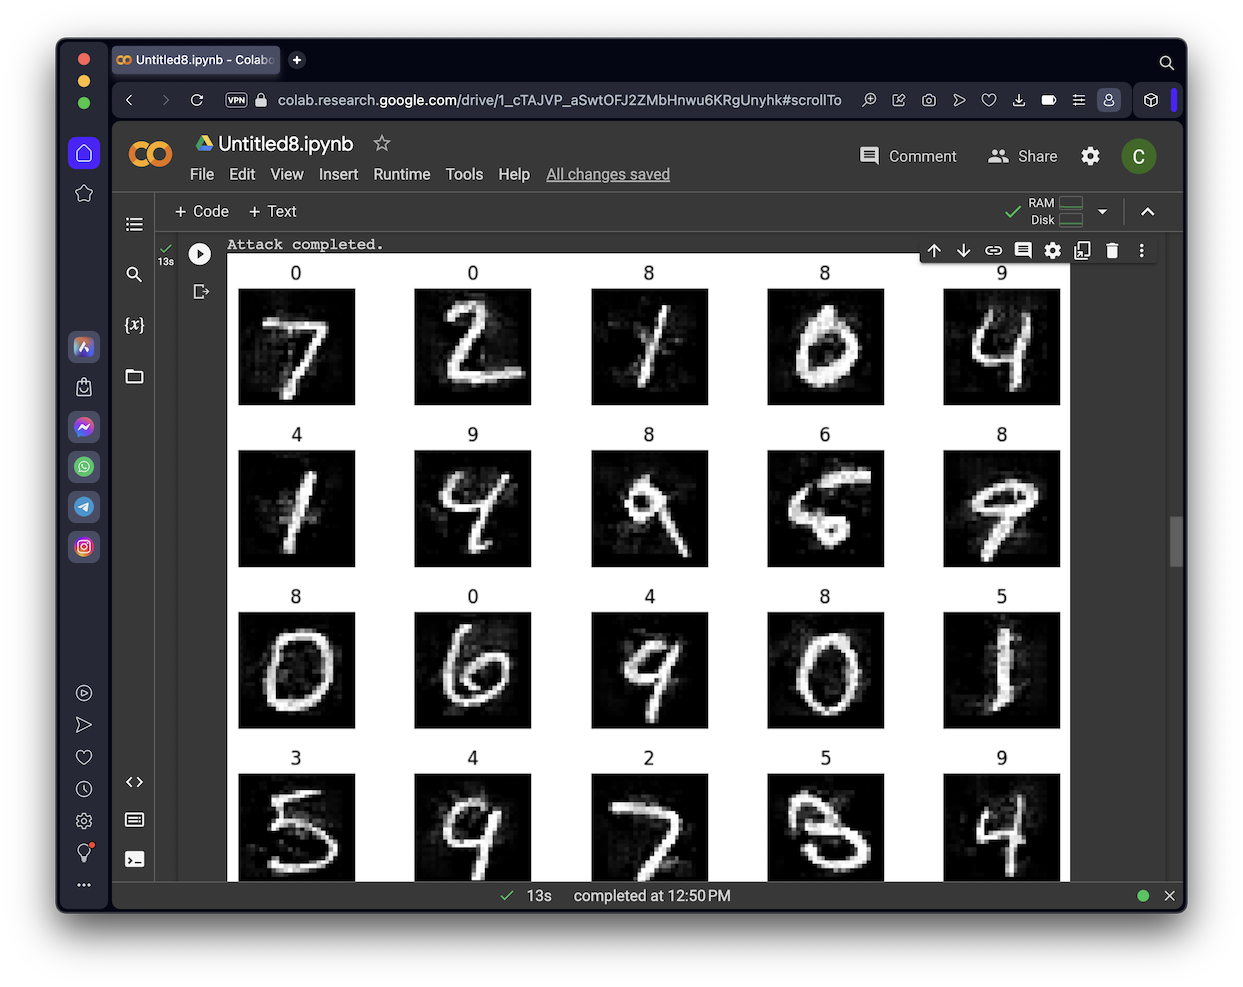
print("Attack completed.")
show_digits_1(eva_adv_ds.X, eva_y_pred, 5)
show_digits_1(eva_adv_ds.X[5:10, :], eva_y_pred[5:10], 5)
show_digits_1(eva_adv_ds.X[10:15, :], eva_y_pred[10:15], 5)
show_digits_1(eva_adv_ds.X[15:20, :], eva_y_pred[15:20], 5)
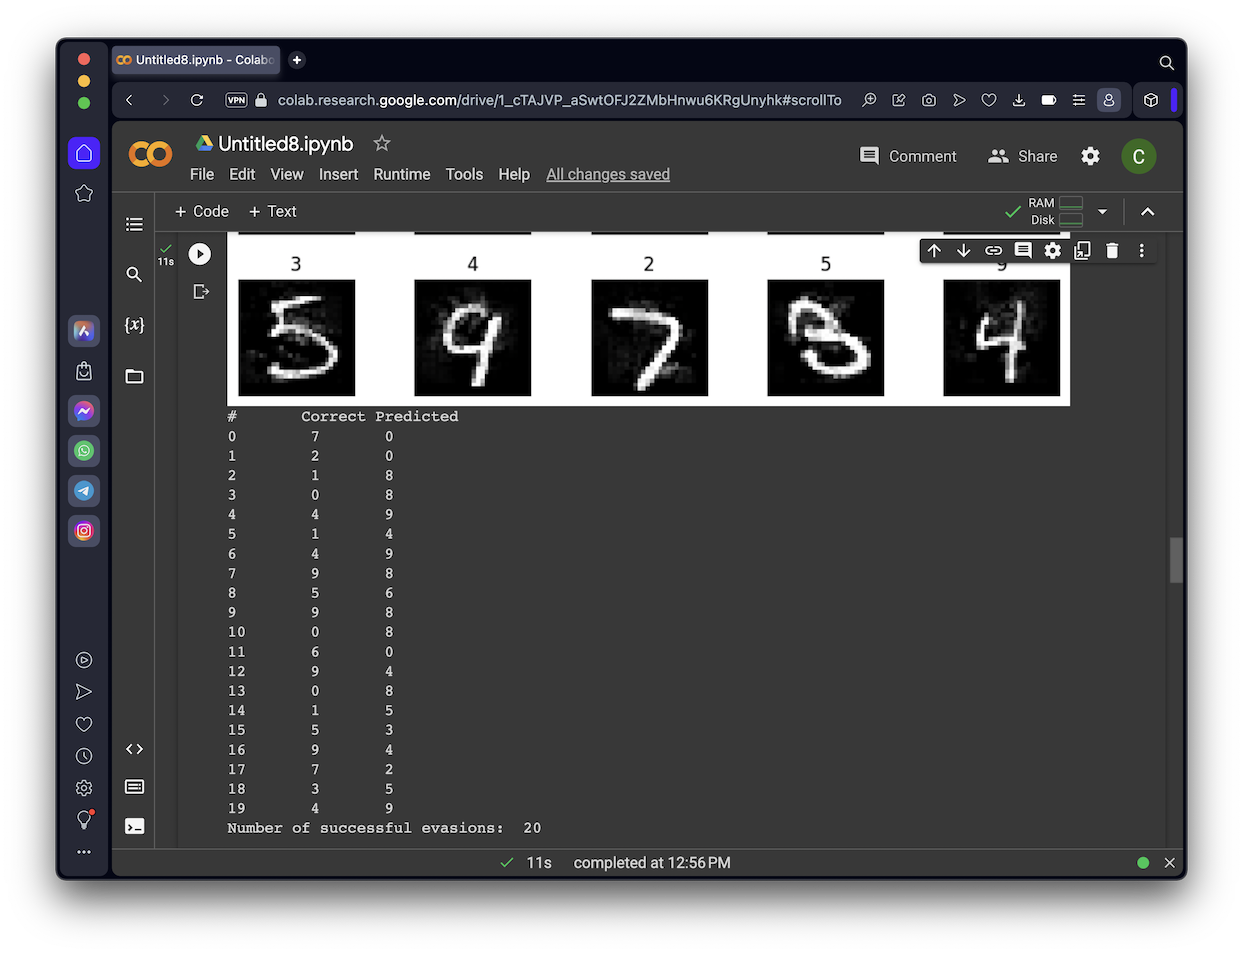
n_wrong = 0
print("# \tCorrect Predicted")
for i in range(20):
correct = ts_set[i, :].Y.get_data()[0]
pred = eva_y_pred[i].get_data()[0]
if correct != pred:
n_wrong += 1
print(i, "\t", correct, "\t", pred)
print("Number of successful evasions: ", n_wrong)
from secml.ml.classifiers import CClassifierSVM
from secml.ml.kernels import CKernelRBF
from secml.ml.classifiers.reject import CClassifierDNR
layers = ['features:relu2', 'features:relu3', 'features:relu4']
combiner = CClassifierSVM(kernel=CKernelRBF(gamma=1), C=0.1)
layer_clf = CClassifierSVM(kernel=CKernelRBF(gamma=1e-2), C=10)
dnr = CClassifierDNR(combiner=combiner, layer_clf=layer_clf, dnn=dnn,
layers=layers, threshold=-1000)
dnr.set_params({'features:relu4.C': 1, 'features:relu2.kernel.gamma': 1e-3})
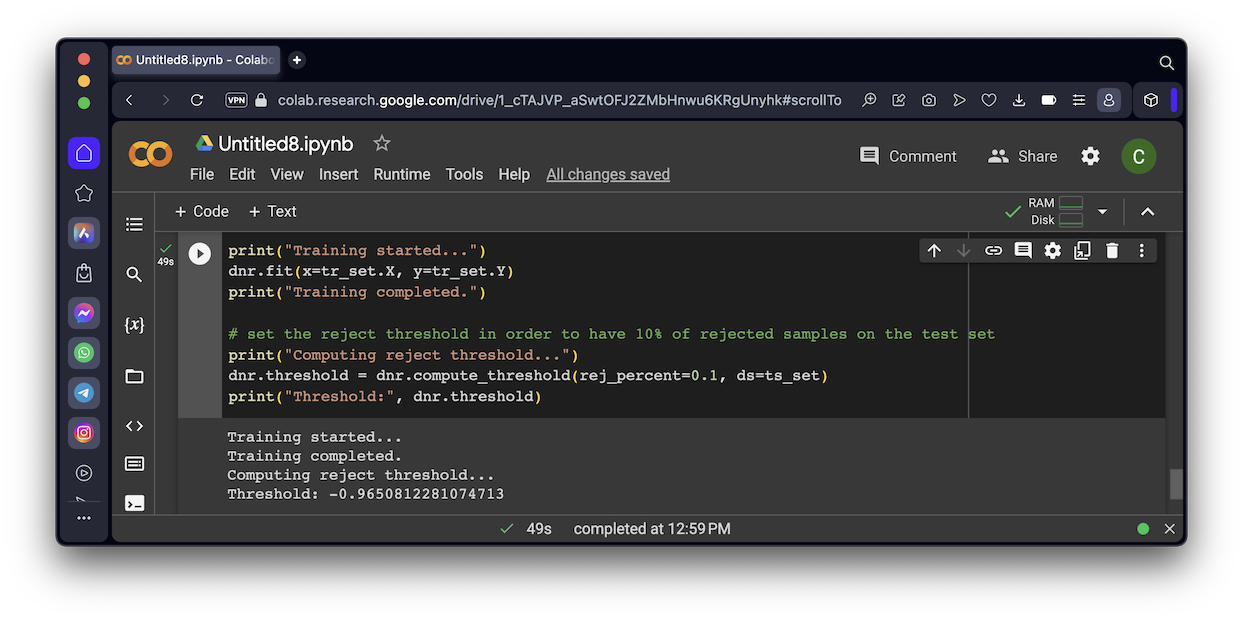
print("Training started...")
dnr.fit(x=tr_set.X, y=tr_set.Y)
print("Training completed.")
# set the reject threshold in order to have 10% of rejected samples on the test set
print("Computing reject threshold...")
dnr.threshold = dnr.compute_threshold(rej_percent=0.1, ds=ts_set)
print("Threshold:", dnr.threshold)
print("Image, Prediction, Correct, Reject?: \tScores")
print("", end = "\t")
for i in range(10):
  print(" ", i, end="\t")
print("Threshold")
for iter in range(20):
  prediction, scores = dnr.predict(ts_set[iter, :].X, True)
  for p in prediction:
    pi = int(p)
    if pi < 0:
      pi = "R"
  for y in ts_set[iter, :].Y:
    yi = int(y)
  print(iter, pi, yi, end = ":\t")
  for s in scores:
    print(int(100 * s), end = "\t")
  print()
from secml.adv.attacks import CAttackEvasionPGDExp

solver_params = {'eta': 1e-1, 'eta_min': 1e-1, 'max_iter': 30, 'eps': 1e-8}

pgd_exp = CAttackEvasionPGDExp(classifier=dnr, double_init_ds=tr_set, dmax=2,
                               distance='l2', solver_params=solver_params)

print("Running attack...")
eva_y_pred, _, eva_adv_ds, _ = pgd_exp.run(x=ts_set[0:20, :].X, y=ts_set[0:20, :].Y)
print("Attack completed.")

show_digits_1(eva_adv_ds.X, eva_y_pred, 5)
show_digits_1(eva_adv_ds.X[5:10, :], eva_y_pred[5:10], 5)
show_digits_1(eva_adv_ds.X[10:15, :], eva_y_pred[10:15], 5)
show_digits_1(eva_adv_ds.X[15:20, :], eva_y_pred[15:20], 5)

n_wrong = 0
print("# \tCorrect \tPredicted")
for i in range(20):
  correct = ts_set[i, :].Y.get_data()[0]
  pred = eva_y_pred[i].get_data()[0]
  if (correct != pred) and (pred >= 0):
    n_wrong += 1
  print(i, "\t", correct, "\t", pred)
print("Number of successful evasions: ", n_wrong)
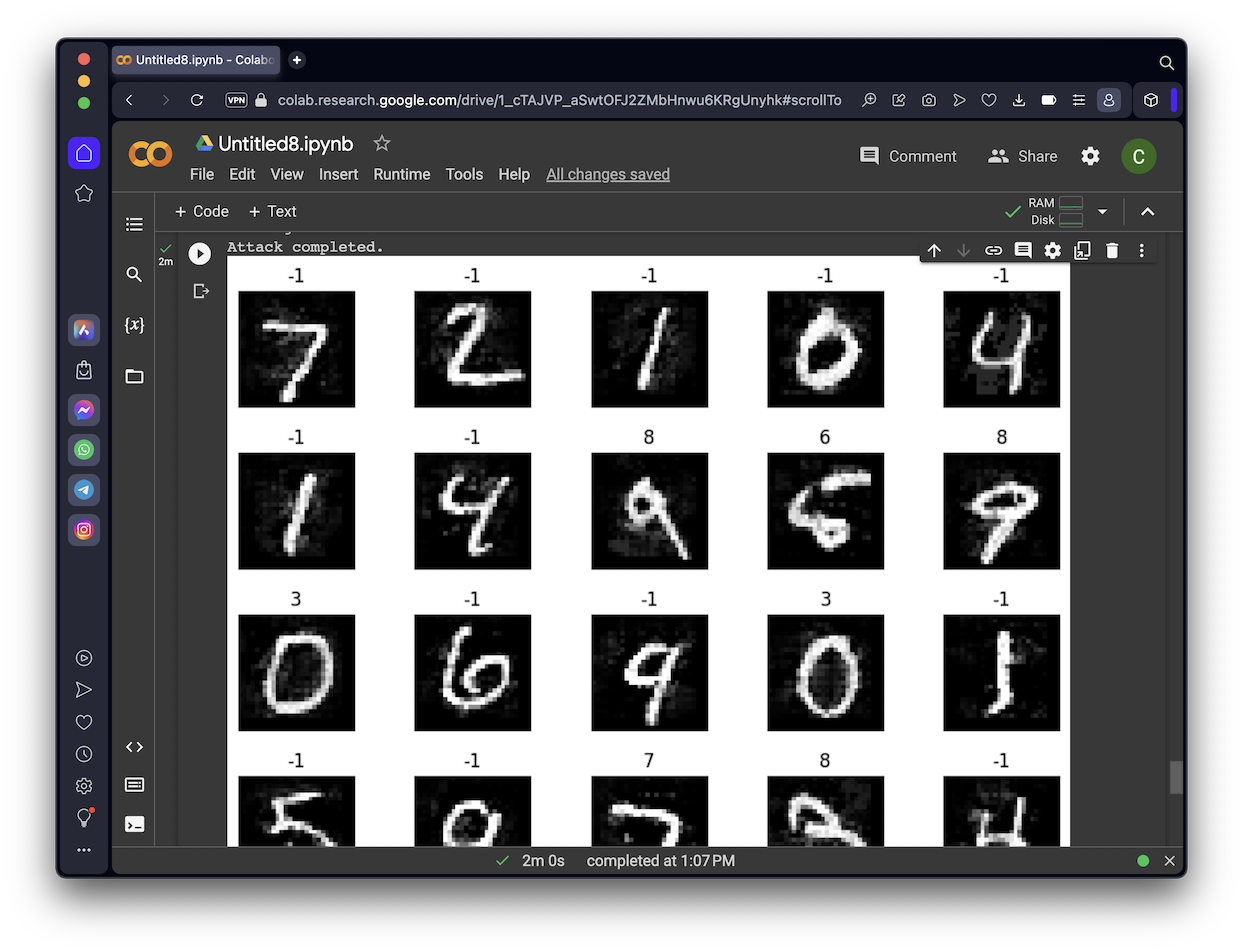
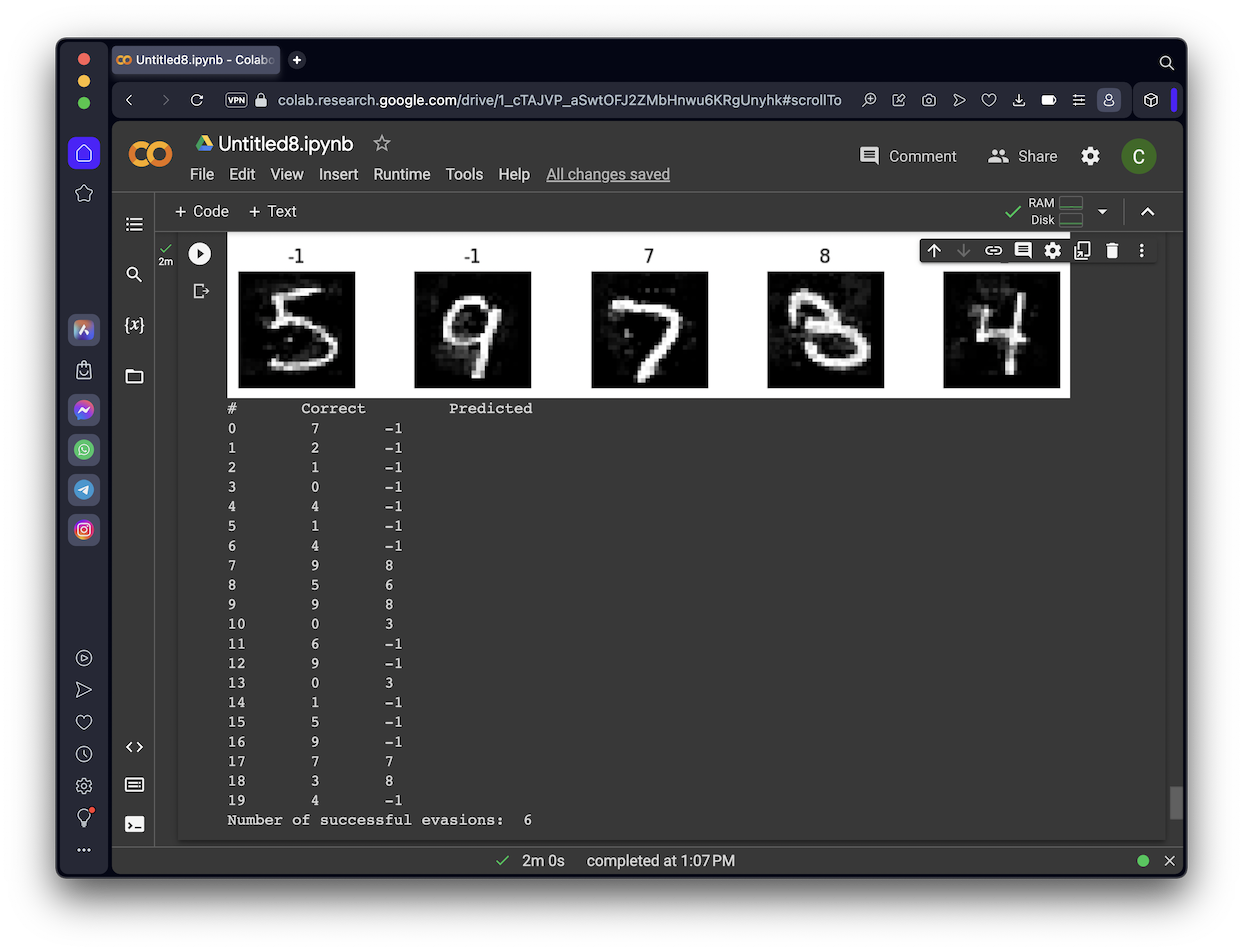
The output shows the attack images, with the predicted classification above each image. Notice that many of the attack images are rejected by DNR, so the prediction is "-1", as shown below.
Flag ML 140.1: Features (15 pts)
Execute this command, which calculates the "norm" of the last image (calculated from the sum of the pixels):The flag is covered by a rectangle in the image below.
Flag ML 140.2: More Rejections (10 pts)
In step 5, adjust the DNR to reject 50% of the images.Now there are only 2 successful evasions of the DNR model.
Execute this command to see the flag:
The flag is covered by a rectangle in the image below.
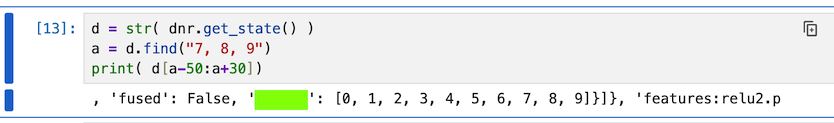
Flag ML 140.3: Fewer Rejections (10 pts)
In step 5, adjust the DNR to reject 2% of the images.Execute these command to see the flag:
The flag is covered by a rectangle in the image below.d = str( dnr.get_state() ) a = d.find("7, 8, 9") print( d[a-50:a+30])
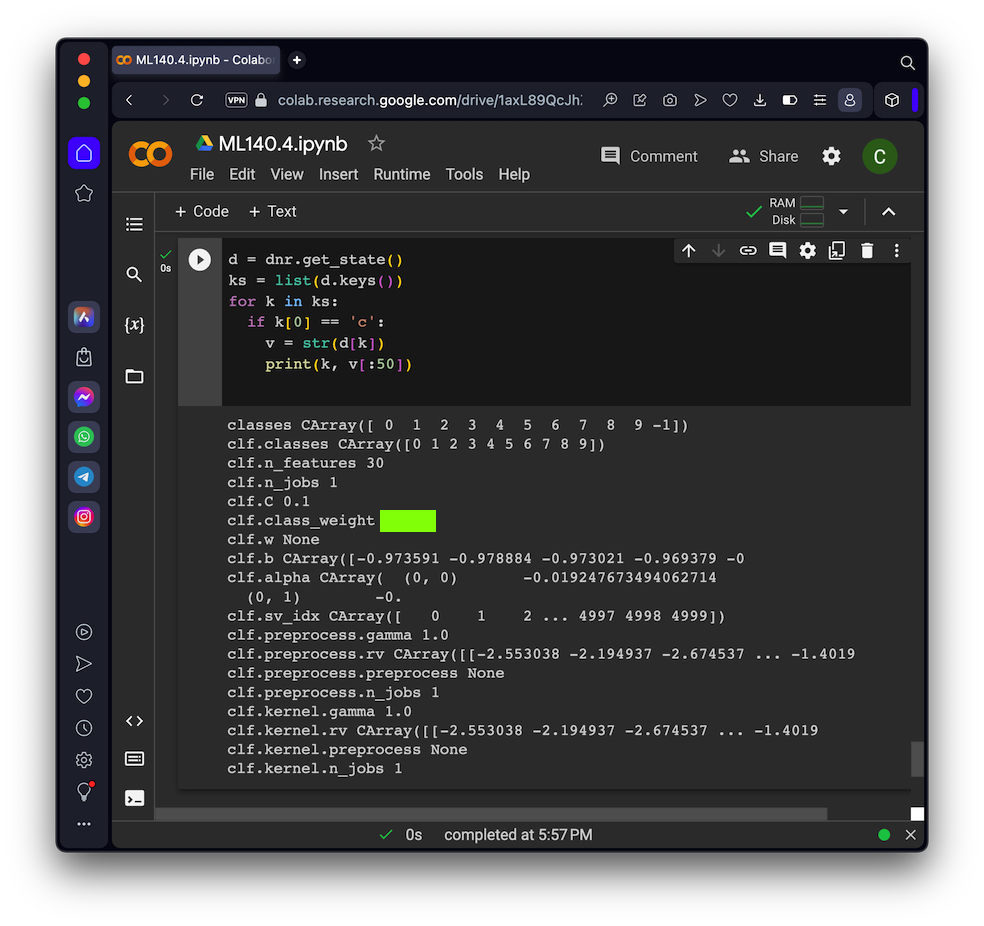
Flag ML 140.4: Fast Attack (10 pts)
In step 5, adjust the DNR to reject 10% of the images.In step 7, adjust the max_iter to 2.
Now there is only 1 successful evasion of the DNR model.
Execute these command to see the flag:
The flag is covered by a rectangle in the image below.d = dnr.get_state() ks = list(d.keys()) for k in ks: if k[0] == 'c': v = str(d[k]) print(k, v[:50])
Posted 5-8-23
Code for flag 4 fixed 12-13-23
"--ignore-requires-python" added 2-15-25
Jupyter server notes added 5-15-25