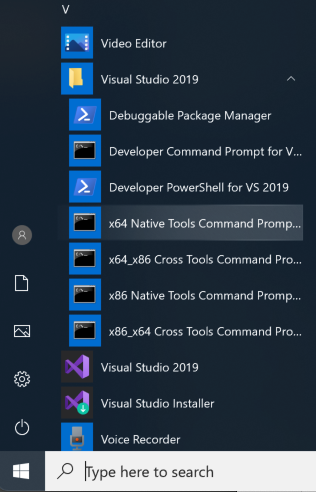
Click "x64 Native Tools Command Prompt", as shown below.
mkdir c:\MyApp
cd c:\MyApp
notepad MyApp.cpp
Paste in this code, as shown below.
void MyFunction(long p1, long p2, long p3)
{
    long x = p1 + p2 + p3;
    long y = 0;
    y = x / p2;
}

void main ()
{
    long a = 2;
    long b = 0;
    MyFunction(a, b, 5);
}
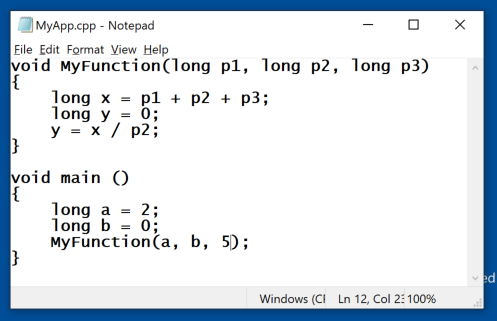
In Notepad, save the file.
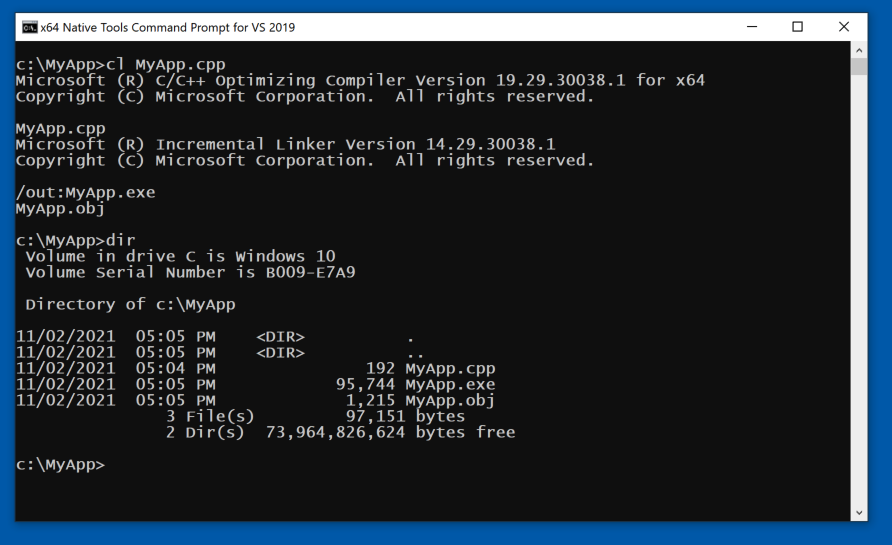
cl MyApp.cpp
dir
Navigate to:
C:\MyApp\MyApp.exe
and double-click it.
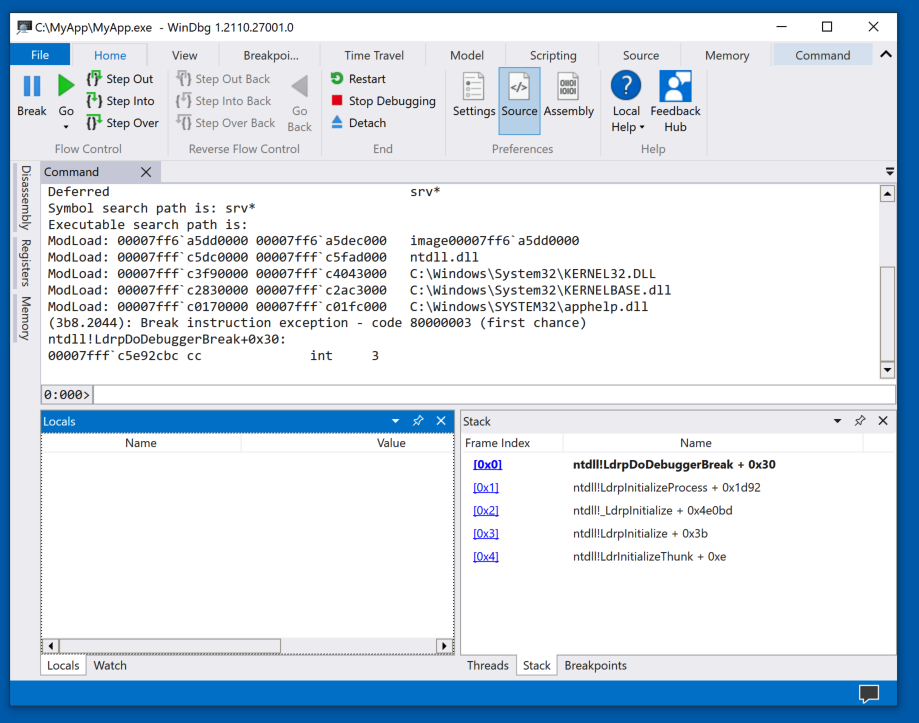
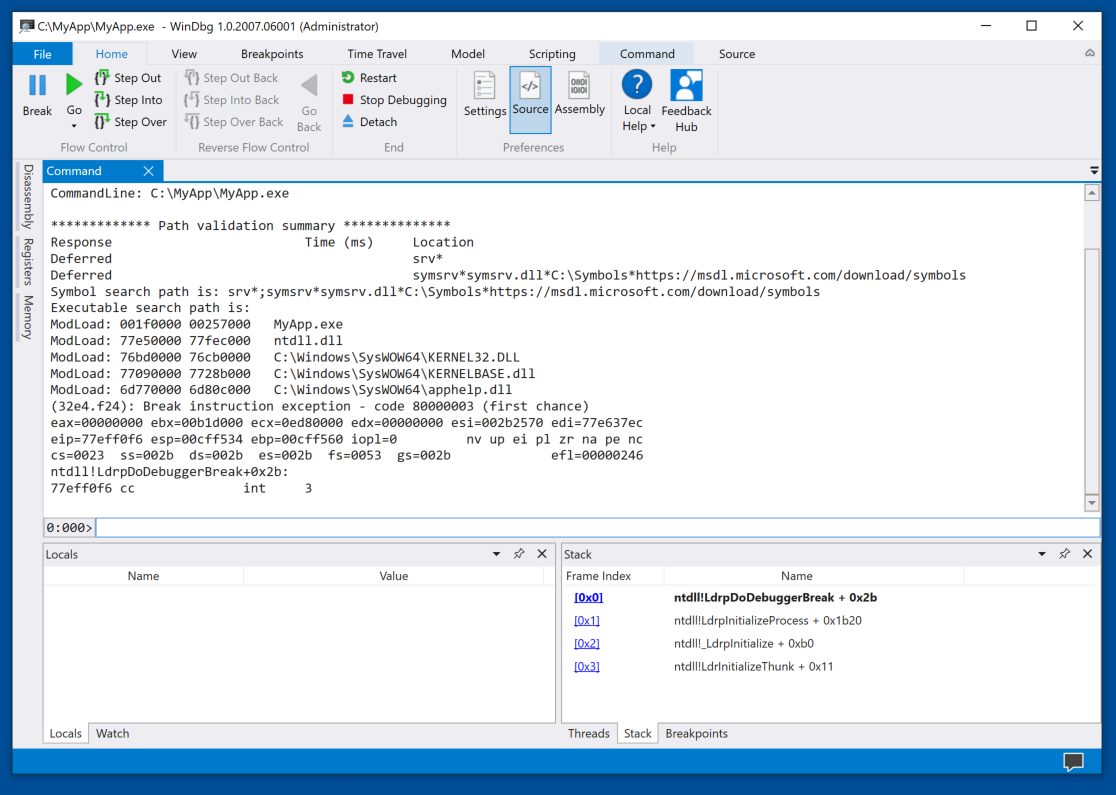
The app loads, and stops inside ntdll, as shown below.
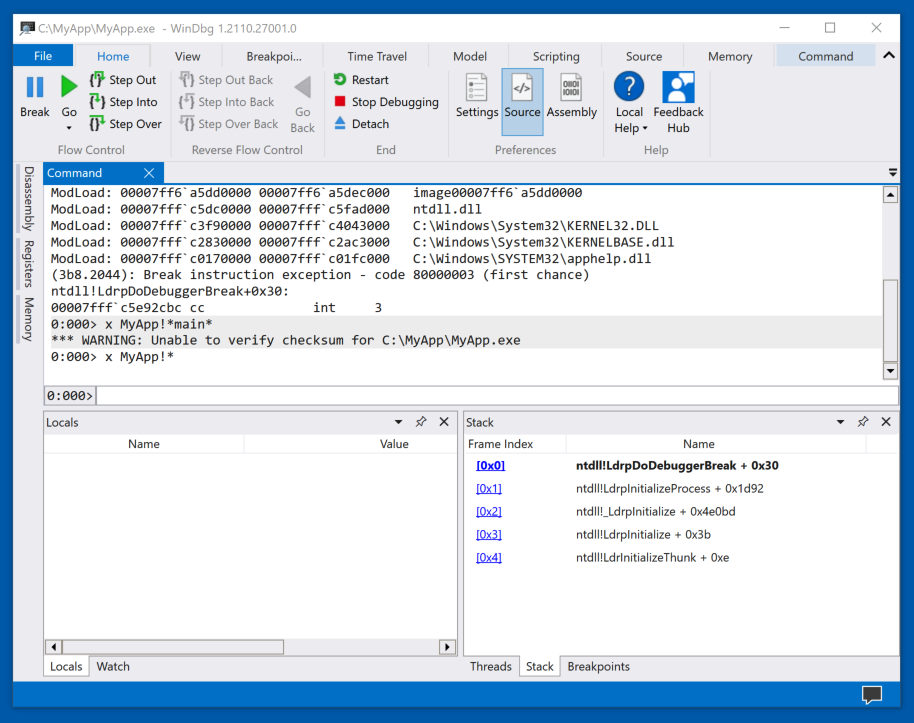
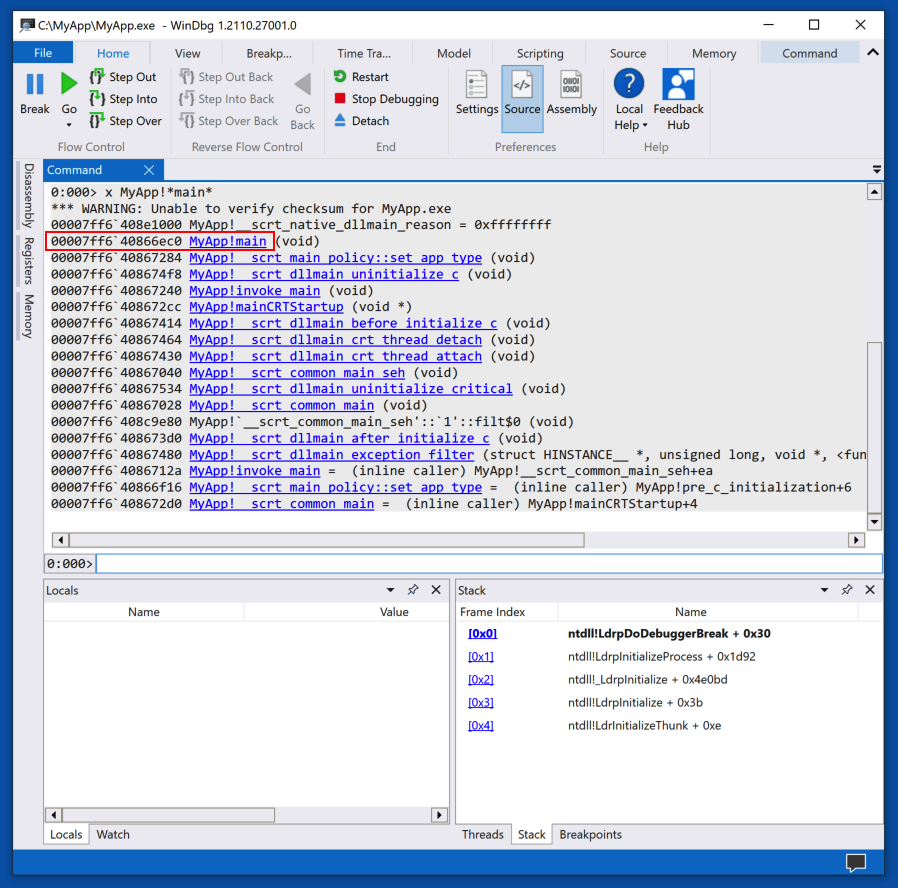
x MyApp!*main*
x MyApp!*
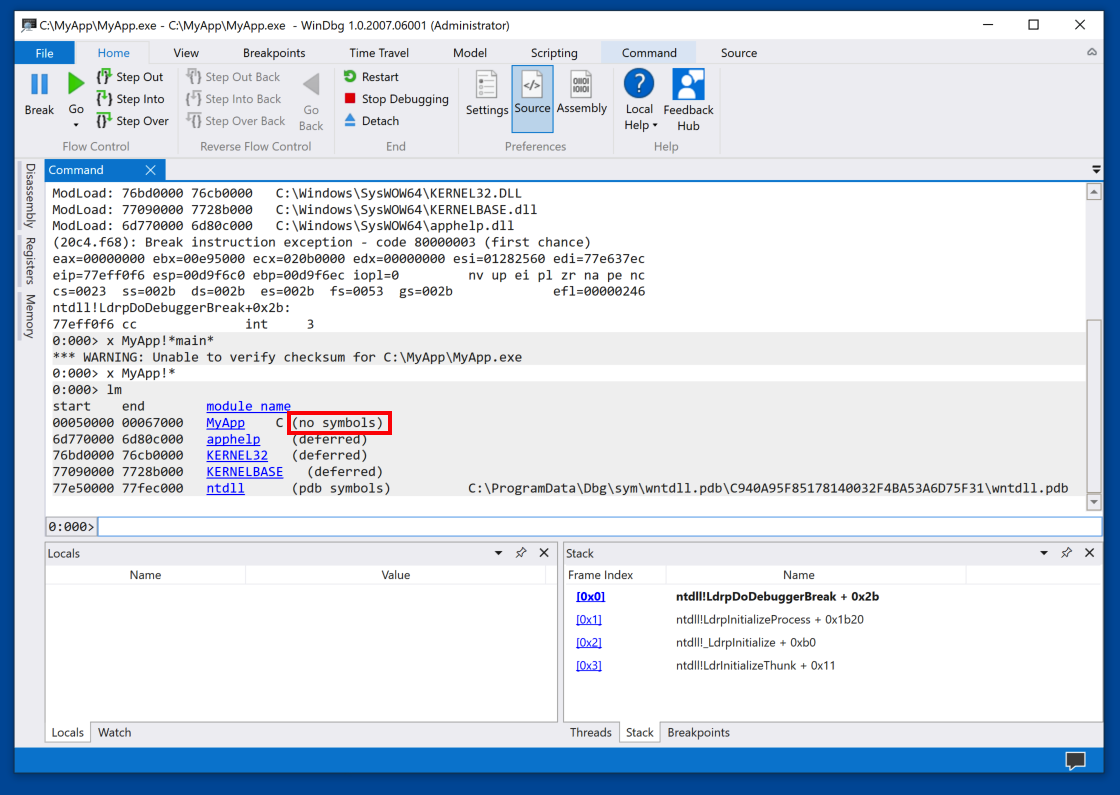
To see the problem, execute this command:
lm
This makes it difficult to find the MyApp code.
Close WinDbg. This is necessary because it locks the MyApp.exe file.
del MyApp.obj
del MyApp.exe
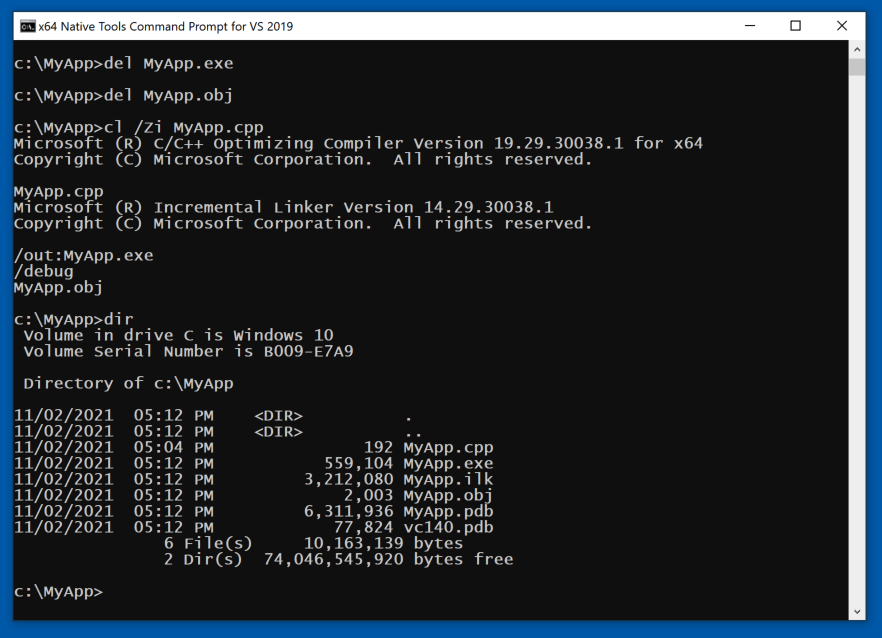
cl /Zi MyApp.cpp
dir
Navigate to:
C:\MyApp\MyApp.exe
and double-click it.
The app loads, and stops inside ntdll, as shown below.
x MyApp!*main*
bu MyApp!main
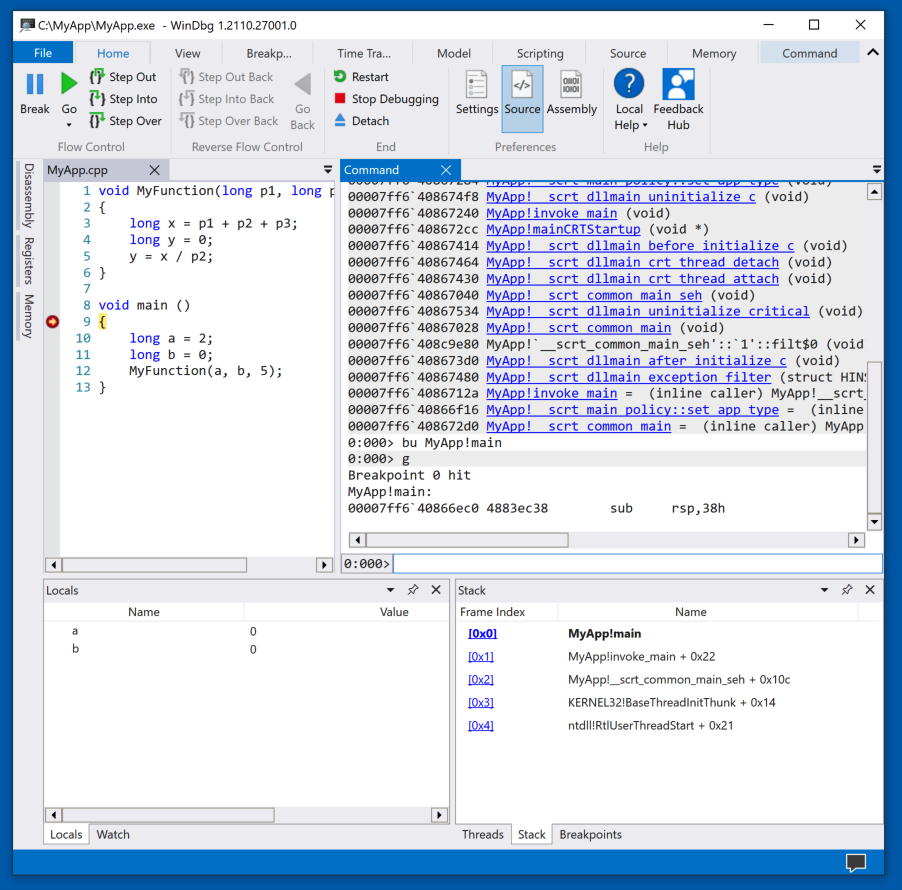
The app runs to the start of main(), and the top left pane shows the C++ source code, with the breakpoint and current instruction highlighted, as shown below.
At the lower left, notice the "Locals" pane. This shows the local variables. Right now they contain zeroes.
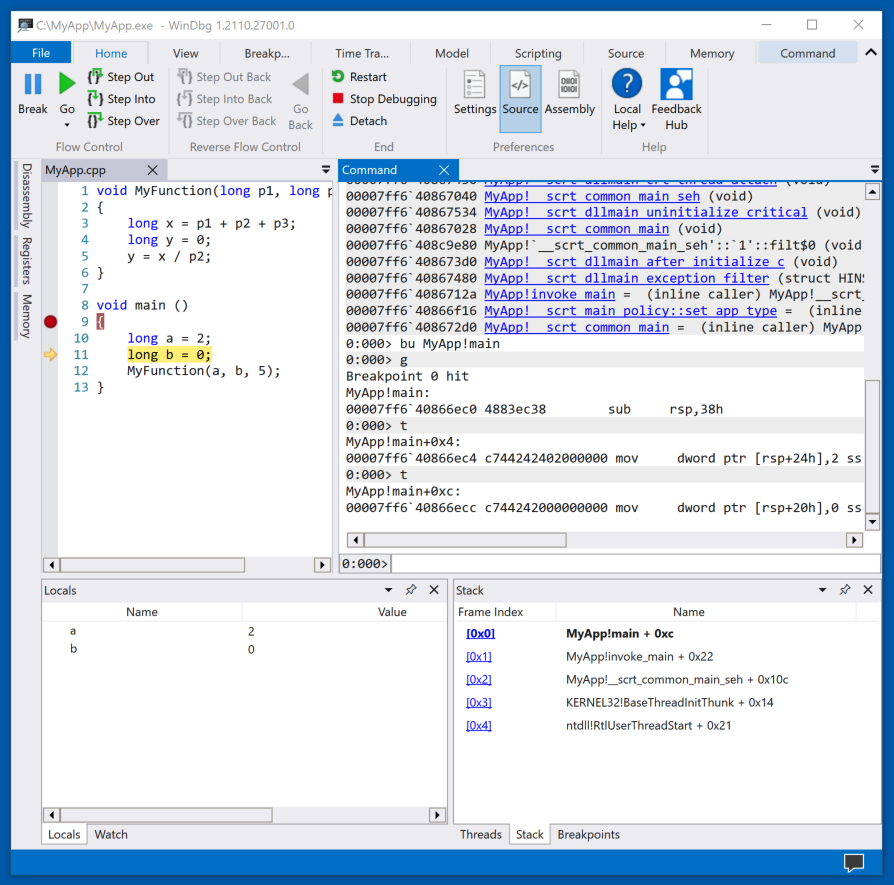
As shown below, the program proceeds to line 11 of the source code. The variable a is now set to 2.
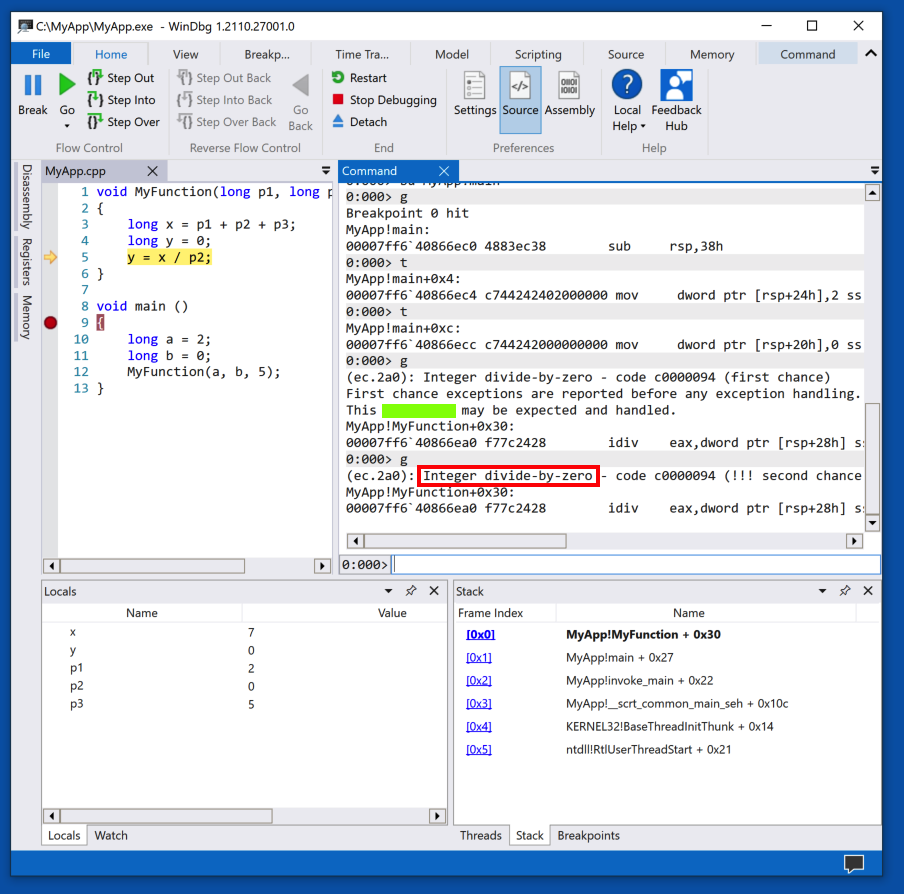
In WinDbg, at the top left, click "Step Into" several more times, until the program executes source line 5.
The program cannot execute this instruction because of a divide-by-zero error, as shown below.
PMA 431.1 Crash Message (10 pts)
The flag is covered by a green box in the image below.
Posted 10-14-20
Project number fixed 10-15-20
Bold tag fixed 10-20-20
Minor improvements 4-13-2021
Flag changed and nothing run as Administrator anymore 11-2-21
"Preview" removed 4-22-24